
CanucksArmy has no direct affiliation to the Vancouver Canucks, Canucks Sports & Entertainment, NHL, or NHLPA
The Statsies: Max Sasson’s line stands out as Canucks fall to Oilers
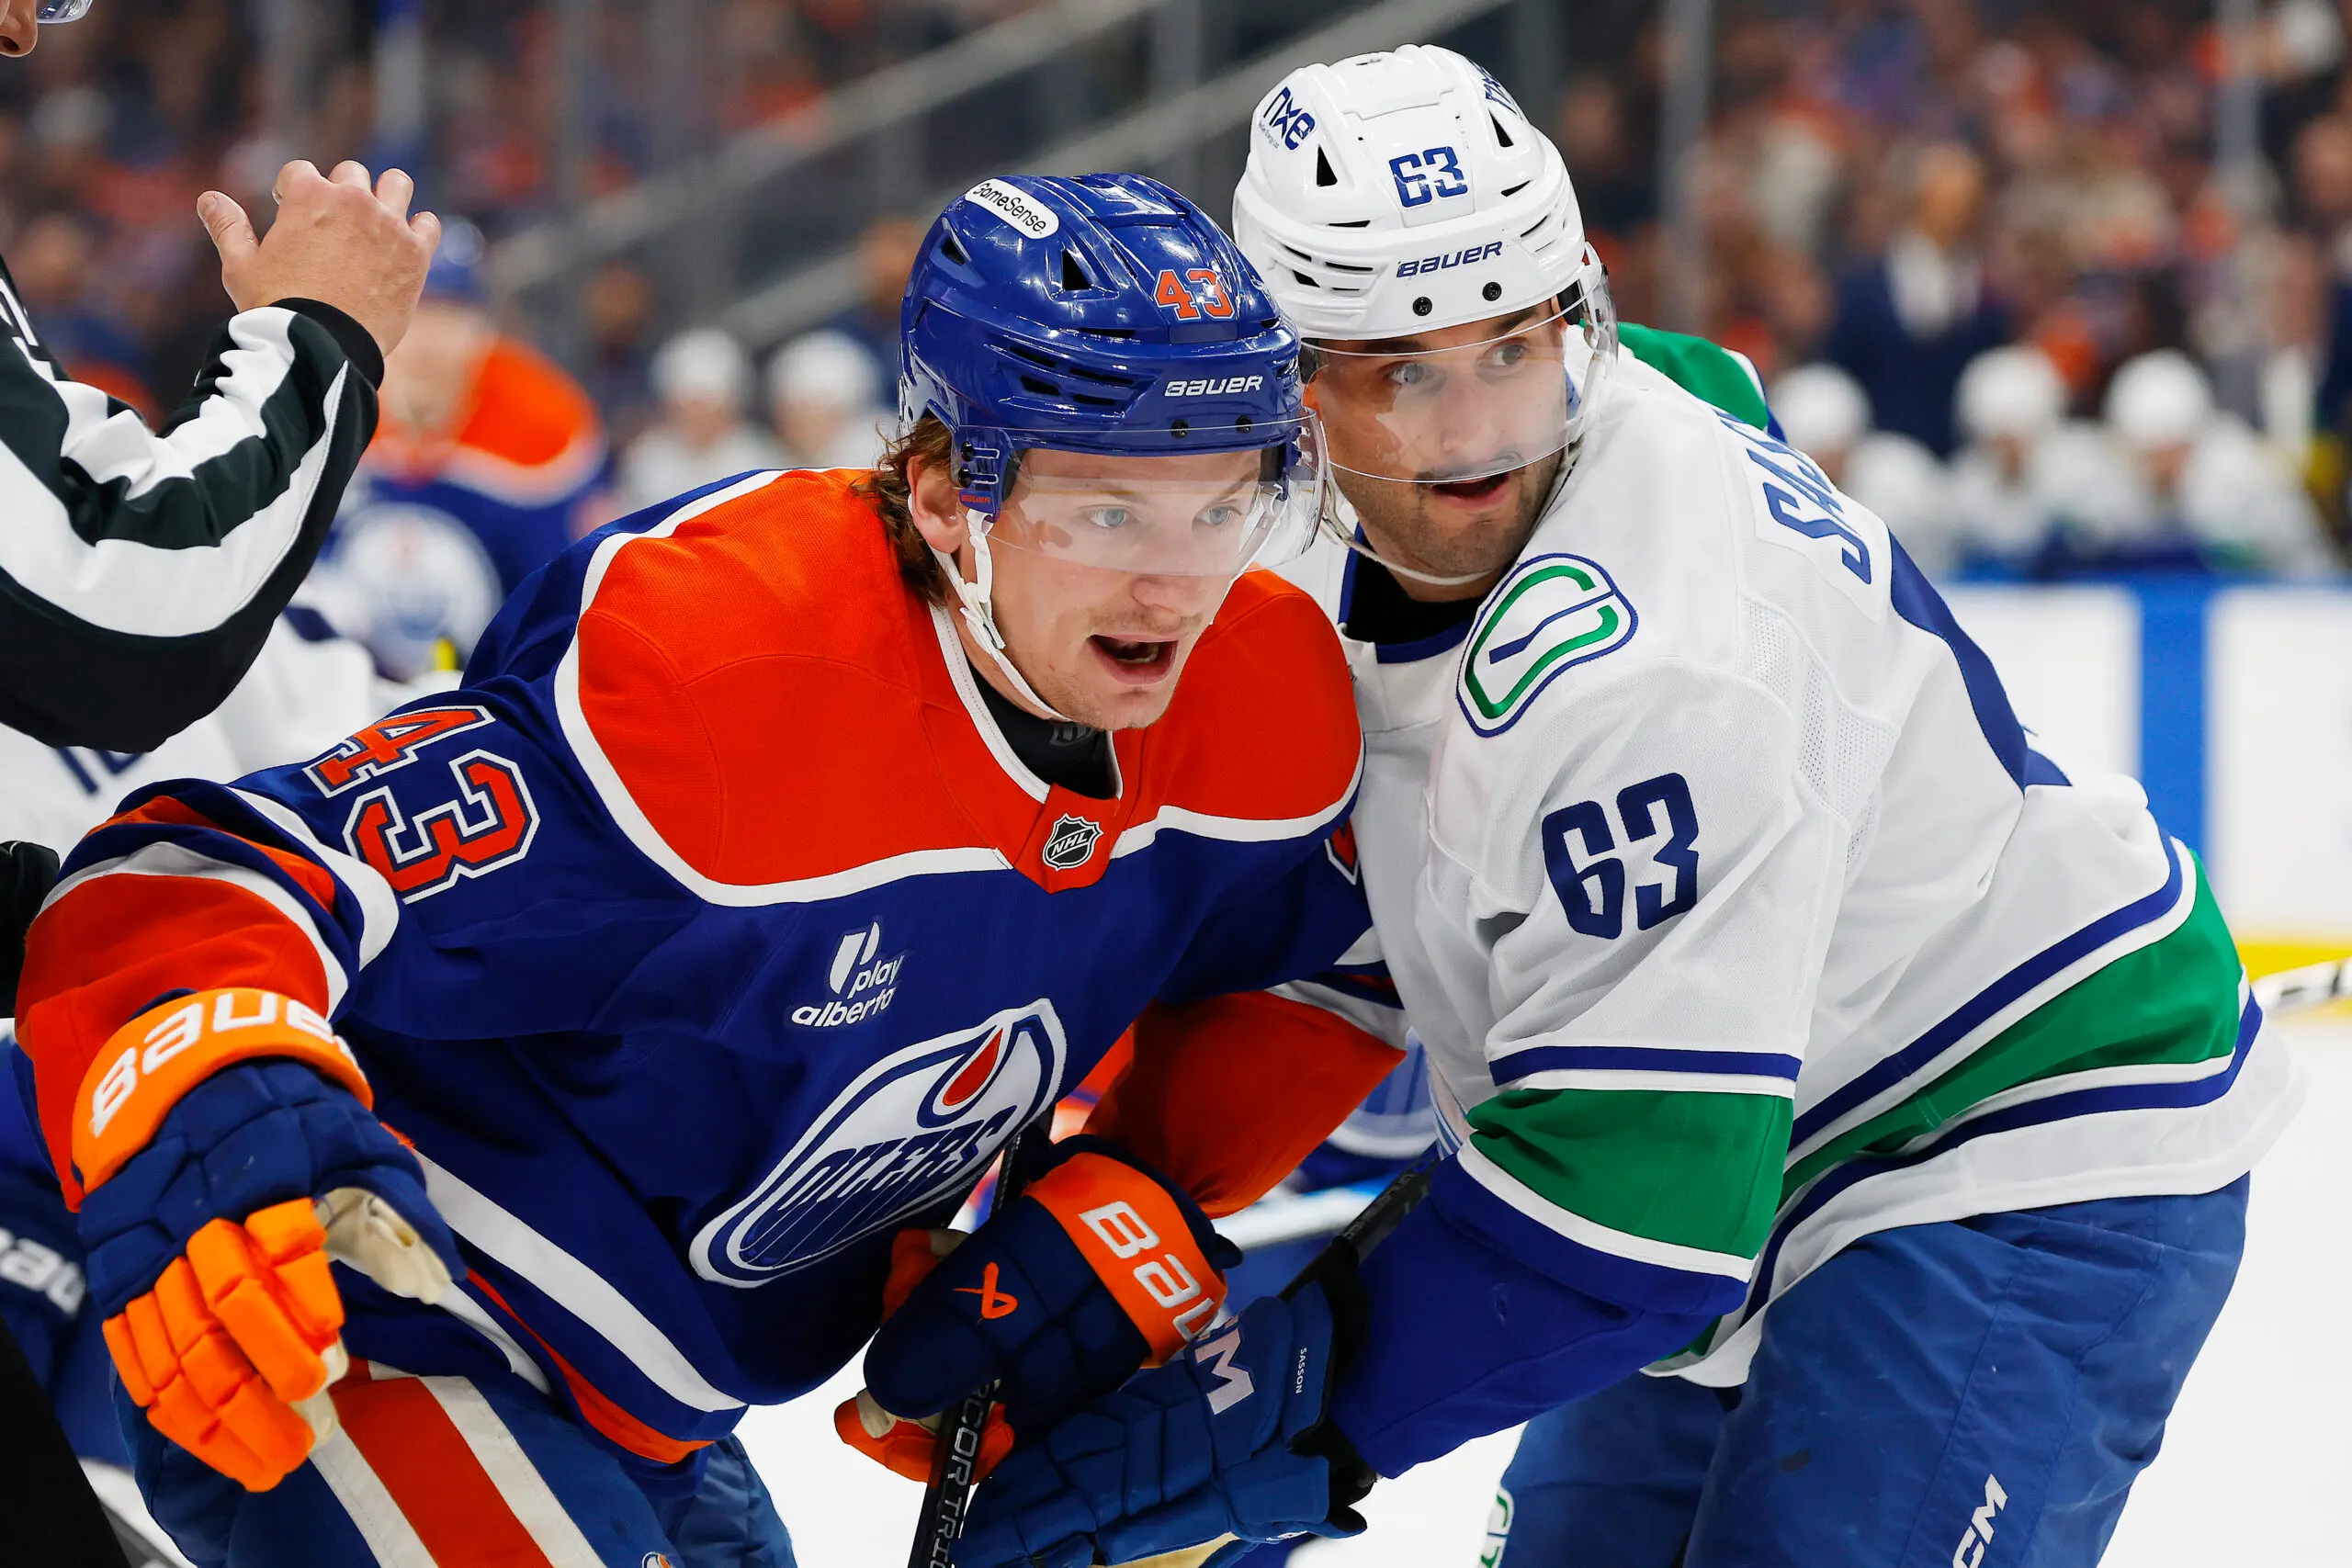
Photo credit: Perry Nelson-Imagn Images

Nov 8, 2026, 16:32 ESTUpdated: Nov 8, 2026, 16:41 EST


The Vancouver Canucks found a line that could push the play against the Edmonton Oilers. Naturally, it was the one at the bottom of the lineup.
Drew O’Connor, Max Sasson and Linus Karlsson gave Vancouver its most convincing five-on-five minutes Saturday, while several higher-profile combinations spent much of their night chasing the puck. The result was the Canucks’ fifth straight defeat, but the numbers always offer more to chew on than the score alone.
Game Flow
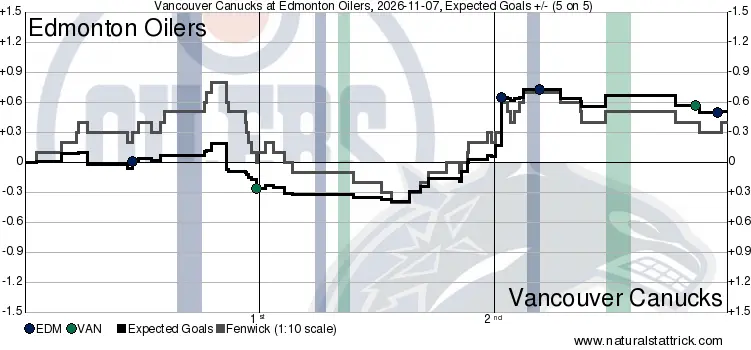
Edmonton looked in charge early, outshooting Vancouver 10-4 at five-on-five in the first period. Yet the quality of chances was almost upside down: the Canucks generated 0.64 expected goals to the Oilers’ 0.37, giving them a 63.11 xGF%, and all four high-danger chances belonged to Vancouver, which got its reward when Sasson tied the game with nine seconds left in the first.
That difference between territory and danger proved short-lived. Even though Vancouver actually won the five-on-five shot-attempt battle 14-11 in the second, good for a 56% CF% — it produced only 0.20 expected goals against Edmonton’s 0.52 — and the Oilers owned all three high-danger chances in the period. A scoreless middle frame was an improvement on Thursday’s collapse in Winnipeg, though the possession numbers flattered the visitors.
Once the third began, the Oilers completely separated. Edmonton controlled 60% of five-on-five attempts and 68.92% of expected goals, with a 0.82-0.37 xG advantage. The Oilers held a 5-1 edge in high-danger opportunities, too. Jason Dickinson broke the tie 49 seconds in, and Leon Draisaitl added a power-play goal minutes later.
Heat Map
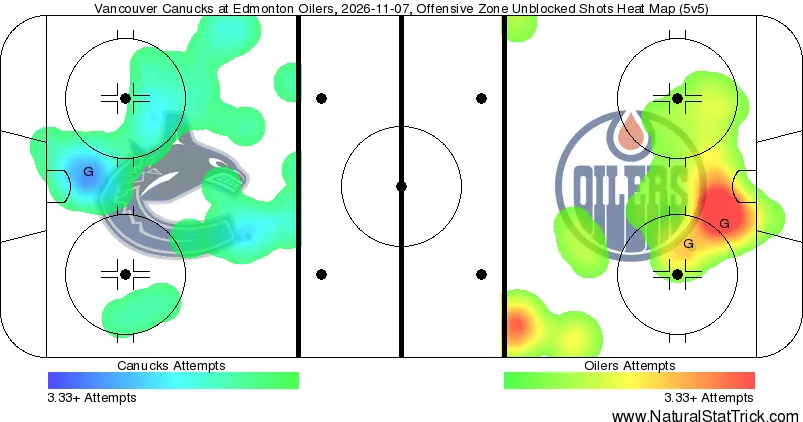
Vancouver’s five-on-five shot map was relatively scattered, with attempts around the circles and across the offensive zone but little sustained activity in the most threatening areas. Edmonton established a denser concentration close to the Canucks’ net, particularly through the slot and near the crease.
Overall, the Oilers finished with eight high-danger chances to Vancouver’s five at full strength, while generating 1.71 expected goals against 1.20. Across all situations, Edmonton’s edge grew to 3.12-2.09 in xG, despite the Canucks generating a few decent looks with the extra attacker.
Special teams were once again the straw that broke the camel’s back. Edmonton scored once on three power plays and produced 0.37 expected goals in 3:52 of five-on-four time, while Vancouver went scoreless in its two opportunities, although 0.51 xGF in 2:53 suggests the Canucks’ puck movement threatened more than the absence of a goal might imply.
Individual Advanced Stats
Corsi Champ: Drew O’Connor led every Canuck with a 77.78 CF% at five-on-five, as Vancouver outattempted Edmonton 14-4 during his 13:17. The Canucks controlled four scoring chances to one and did not surrender a high-danger look with him on the ice — quite a response from a player challenged over his penalty troubles by Manny Malhotra.
Corsi Chump: Vancouver controlled just 27.78% of shot attempts in Paul Cotter’s 10:59 at five-on-five, as the former New Jersey Devil spent another night as the Canucks’ Corsi Chump. His shifts produced a 5-13 attempt deficit, a 2-8 disadvantage in scoring chances and no high-danger opportunities against three conceded. The 11.12 xGF% was the lowest on the roster, and his line with Jake DeBrusk and Jonathan Lekkerimäki struggled to establish much of anything offensively.
xGF: Sasson and Karlsson deserve their own mention rather than sharing O’Connor’s spotlight. Sasson finished with a 77.16 xGF%, while Karlsson posted 72.59 xGF%. Together, the three outattempted Edmonton 9-4 during 9:27 and owned 74.64% of expected goals, generating four scoring chances to one. Karlsson was dangerous individually, too, recording six shot attempts at five-on-five.
GSAx: In the Leevi vs. Levi battle, Leevi Meriläinen stopped 26 of 29 shots for an .897 save percentage, with three goals allowed against 2.21 expected goals faced while he was in net. That works out to minus-0.79 goals saved above expected. In the other crease, Devon Levi turned aside 20 of 22 shots against 2.09 xGA, finishing at plus-0.09 GSAx, suggesting neither goaltender was the chief reason the game tilted Edmonton’s way.
Statistical Musings
The new top line had a rough debut: Arshdeep Bains’ promotion beside Elias Pettersson and Boeser did not pay off at five-on-five; in 11:02 together, Vancouver was outattempted 11-7, generated just two scoring chances to Edmonton’s seven, and controlled 35.59% of expected goals. Bains finished without a shot attempt, and his missed coverage on Mattias Ekholm’s opener illustrated the danger of losing a player when McDavid draws eyes in the defensive zone. As our breakdown of Malhotra’s systems explains, pressuring the puck cannot come at the expense of protecting the middle.
Lekkerimäki’s switch came at a price: After he, Marco Rossi and Liam Öhgren showed signs of chemistry together on Tuesday, Lekkerimäki skated alongside Cotter and DeBrusk on Saturday. That trio managed a miserable 11.92 xGF% in 8:50, generating 0.08 expected goals and allowing 0.59. They were outshot 6-1 and surrendered three high-danger chances without creating one. Rossi and Öhgren, meanwhile, still held a 52.31 xGF% alongside Brendan Gallagher, despite controlling only 30.77% of shot attempts.
Buium and Hronek did the heavy lifting: Zeev Buium played 26:03 overall and finished with a 40% five-on-five CF% and 34.84 xGF%, while the Oilers generated five high-danger chances in those minutes. Filip Hronek logged a hefty 29:50, producing a 45.45 CF% and 43.12 xGF% at five-on-five. The top pair faced a demanding assignment, but these figures will do little to quiet questions about their effectiveness together.
As a team
CF% – 46.48% | HDCF% – 38.46% | xGF% – 41.36%
Score and venue-adjusted five-on-five numbers were hardly kinder for the home team, decreasing the CF% to 45.90%, while slightly increasing HDCF% to 40.17% and xGF% to 42.15%. Vancouver could point to a productive depth line and a cleaner stretch of play in the second period than it managed against Winnipeg, but Edmonton still dictated where the more dangerous chances came from.
A disputed late icing drew plenty of angst from Canucks fans, which was understandable after Boeser had brought Vancouver within one, but the game had been tilting in Edmonton’s favour long before that whistle blew. Saturday was a glimpse against a premier team of what the Canucks might be able to build on, but it also showed how much work is left to do before becoming a contender.
All statistics courtesy of naturalstattrick.com
Sponsored by bet365


Breaking News
- The Statsies: Max Sasson’s line stands out as Canucks fall to Oilers
- Canucks prospect may miss 2027 World Juniors after IIHF informs Norway that Russia will replace them
- The Stanchies: Canucks play a tight game of hockey in 4-2 loss to Oilers
- Instant Reaction: Canucks battle hard and make late push in 4-2 loss to Oilers
- Former Canuck Vasily Podkolzin has more than found a home in Edmonton

Vancouver CanucksTeam Cap Summary

Cap Summary
2026-27
2027-28
Projected Cap Hit
$87,993,412
$71,329,167
Projected Cap Space
$16,006,588
$42,170,833
Current Cap Space
$20,034,052
$42,170,833
Active Players
23/23
13/23
Draft Picks
Round
'27
'28
1
1
1
2
2
2
3
1
1