Quinn Hughes can't believe the holding call #Canucks

Nation Sites
The Nation Network
CanucksArmy has no direct affiliation to the Vancouver Canucks, Canucks Sports & Entertainment, NHL, or NHLPA
The Statsies: The numbers behind JT Miller’s rough night in Canucks’ loss to Oilers

Photo credit: © Bob Frid-Imagn Images

By Michael Liu
Nov 10, 2024, 13:30 ESTUpdated: Nov 10, 2024, 13:20 EST
Okay, that certainly escalated fast.
The Vancouver Canucks got shelled by the Edmonton Oilers, giving up four straight goals in the third period to end up losing 7-3 on home ice. It was and ugly scoreline to close out the game, but through forty minutes, it was at least interesting. Despite going down 3-0, the Canucks pushed back and made it at least a contest into the second period – and then all the wheels fell off of the train. There aren’t too many positives to take away from this performance, but some silver linings were to be had from this one.
Here’s the loss, by the numbers.
As always, you can find our glossary guide of advanced stats here.
Game Flow
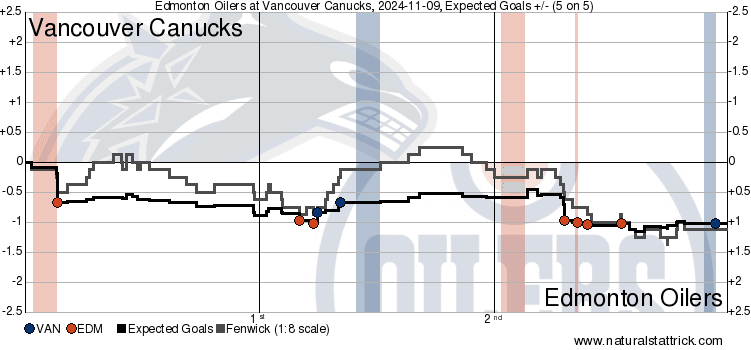
Honestly, if just looking at the game flow from just the first two periods, things didn’t seem that bad. Edmonton dictated the possession share in the first with 58.62 CF%, which translated to a dominant 85.70 xGF% share for them. They were able to carry that forth through the start of the second, capitalizing for a 3-0 lead, but Vancouver was able to dig themselves back and play their game in the middle frame. The Canucks would finish with a 58.88 CF% and 66.22 xGF%, showing a marked improvement by only conceding one high-danger chance against in the second after giving up six in the first. However, the third period was just a tirefire, with defensive breakdowns in quick succession leading to a massive 7-2 lead – but realistically, the Oilers weren’t playing any better than they were in the first period with 66.67 CF% and 67.94 xGF%.
Heat Map
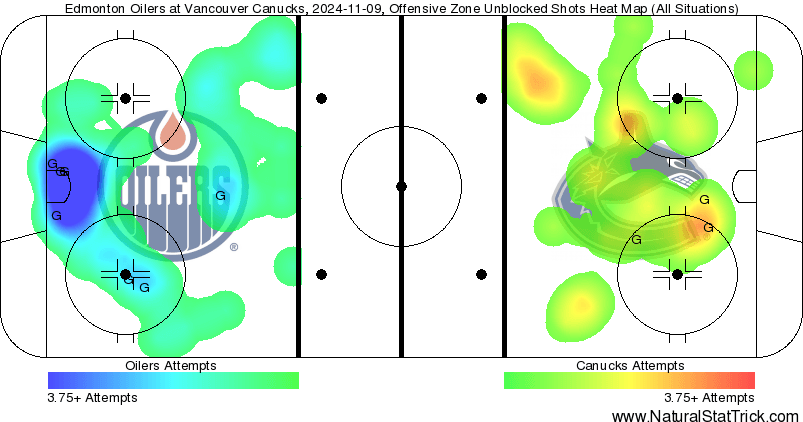
The heat map demonstrated a cumulation of a trend the Canucks were developing through their last stretch of games. Edmonton’s powerplay was always going to buoy their scoring chances, finishing at 26-17 and 17-2 high-danger chances across all situations. But the extent of their success at 5v5 should be concerning – the Oilers only had an 18-16 edge in scoring chances, but put up an 11-2 lead in high-danger chances. Giving up that many looks to an Edmonton team is rough, even if Connor McDavid isn’t at 100%. Sooner or later, with that many opportunities, any team would capitalize and make the Canucks pay for giving up that many grade A chances. As well, it is brutal that Vancouver still can’t generate any chances. 2 high-danger chances across an entire game are straight-up not good, and further compounding that was that the Canucks didn’t have a single high-danger chance on the powerplay – AGAIN. This time, it was against the league’s worst penalty kill.
Individual Advanced Stats
Corsi Champ: Considering everything, Quinn Hughes leading the way in CF% should make sense. One of only 5 Canucks to finish above the 50% plateau, the captain led the way with a 54.55 CF% as he tried to turn the tides of the game. Unfortunately, by proxy of being on ice so much, Hughes bore the full brunt of the Edmonton onslaught. He was on ice for a team-worst 1.31 xGA, facing down a 1-7 high-danger chance deficit despite splitting at an 11-9 scoring chance advantage for Vancouver. Unfortunately, Hughes is just one player, and one player was not going to make a world of difference for the Canucks in this one.
Corsi Chump: Oh boy. We’ll wait to unpack the full depths of this one, but for now, JT Miller was the Canucks’ worst Corsi man with a 16.67 CF%, pegging him at -34.10 CF% rel to team average. It simply wasn’t a good game for Miller, and one we’ll be dissecting in just a moment.
xGF: It’s nice to see this one. Nils Höglander led Vancouver last night with a 66.18 xGF%, posting a third-best 0.22 xGA while being on ice for a 7-2 scoring chance lead. Even more impressive than that was that Höglander only saw a 1-1 split in high-danger chances, meaning that he and his line weren’t bleeding horrifically in a game where every other line combination felt porous. With the injury to Brock Boeser keeping him sidelined indefinitely, Höglander slotted in with Elias Pettersson and Jake DeBrusk, making a much better fit there than the Miller line against the Kings.
GSAx: There was only so much lifting that Kevin Lankinen could do, and it reared its head last night. Facing down 3.39 xGA, the seven goals against meant the Finn finished with a horrific -3.61 GSAx, though it really isn’t a reflection of his performance between the pipes. Vancouver could do nothing in front of him to help him out, resulting in 4 high-danger goals, 1 middle-danger goal, and 2 low-danger goals. Lankinen did all he could, including posting a save-of-the-year candidate.
KEVIN LANKINEN WITH A SAVE OF THE YEAR CANDIDATE! 🎥: Sportsnet | NHL #Canucks
Statistical Musings
Let’s talk about JT Miller: Now for the moment that everyone’s been waiting for. JT Miller was putrid last night, and that might be a generous adjective to give him. While he was played against McDavid for a chunk of the night, Miller wasn’t exactly assigned match-up duties, which makes his numbers tougher to bear as well. That 16.67 CF% was nearly a full 14% lower than the second-worst player on the team, while the 1.19 xGA that Miller faced only trailed Hughes. Coupling that with the second-worst xGF of 0.06 (behind noted offensive powerhouse Noah Juulsen’s 0.01), it resulted in a horrific 4.44 xGF%. Yes, while Miller was on ice, the Oilers had a 95.56 xGF% share. The centerman tied for the most scoring chances faced with 9, only managing to get 1 going the other way. To no one’s surprise, Miller was not on ice for a single high-danger chance for while being on ice for 6 high-danger chances against. It comes as no surprise that the Suter-Miller-Garland line finished bottom across all forward lines in all stats.
Tough night for Miller. Shots are 5-0 for the Oilers with Miller on the ice at 5-on-5. Goals are 2-0. Felt like Tocchet put Pettersson on his line at the end of the second to try to get Miller going — not a sentence I would have expected to write earlier in the season. #Canucks
It’s gotta be coming, right?: Elias Pettersson’s building form finally bore some fruit last night, with the Swede tipping home a goal and recording an assist for a multi-point night after so long. It was probably one of his better performances of the year, and in a game where so much went wrong for the Canucks, it’s a nice silver lining to have. He had Vancouver’s second-best CF% of 53.57, tallying the third-best xGF of 0.55 and fourth-best xGF% of 58.63. That also came with a 9-3 edge in scoring chances, though it resulted in just a 1-2 high-danger chance split. Honestly though, given the circumstances, it’s nice to see a tangible result for Pettersson while the Canucks fell flat on their faces.
Elias Pettersson rings a shot off the post. It's great to see Petey shooting the puck on the power play again. 🎥: Sportsnet | NHL #Canucks
Probably never going to happen again: 7-11 might be a nice convenience store, but 11 forwards and 7 defencemen were anything but nice or convenient for the Canucks last night. Trying out Noah Juulsen rotating in on the back end didn’t result in much positives, the defenceman posting the worst xGF% of any defencemen with just 6.26. However, it wasn’t just the back end that it impacted, as that meant the forward lines would need to see a bit of rotation to keep the ice times balanced. That also hideously exposed Nils Åman to higher levels of competition than he would be suited for. Hilariously enough (in a bad way), the Swedish center would be the third Canuck to finish with a sub-10% xGF%, a 7.93 xGF% to go with the 5th-worst xGA on the roster with 0.85. It didn’t seem that Åman had much to offer the likes of DeBrusk who flanked him at times last night, and pushing these players into situations that don’t play to their strengths resulted in this, even on a supposed strength of his on the PK.
Draisaitl just toying with Nils Åman 🎥: @OilersAdam
As a team
CF% – 41.24% HDCF% – 10.53% xGF% – 28.04%
Vancouver got pummelled and deservedly so. They couldn’t generate chances for anything and nearly every single player that they threw out there had a bad night. These games happen, and it’s understandable that not everyone will be firing on every given night. But for the chances to not be there, for the Canucks to again continue to struggle with creating high-danger looks at 5v5 and on the powerplay is frustrating, especially given the talent they have and the opposition’s own weaknesses on the penalty kill. A 10.53 HDCF% across all situations is just unacceptable, especially against the league’s worst penalty kill and a defensive unit that still has Darnell Nurse playing top 4 minutes.
Vancouver has some time off before hosting the Calgary Flames at home on Tuesday.
Stats provided by naturalstattrick.com
Sponsored by bet365
Breaking News
- CA’s top 20 Canucks summer prospect rankings: Honourable Mentions & Criteria
- Canucks open 2026-27 NHL season with home and home vs. Oilers
- WWYDW: Which former Canuck would you bring in to mentor the rebuild?
- So, what would a reasonable Shane Wright trade look like for the Canucks?
- Trade tree: Revisiting the deal that brought JT Miller to Vancouver in 2019

Vancouver CanucksTeam Cap Summary

Cap Summary
2026-27
2027-28
Projected Cap Hit
$86,185,833
$62,923,333
Projected Cap Space
$17,814,167
$50,576,666
Current Cap Space
$17,814,167
$50,576,666
Active Players
23/23
13/23
Draft Picks
Round
'26
'27
1
2
1
2
2
2
3
1
1