I Is For Injuries

6 years ago
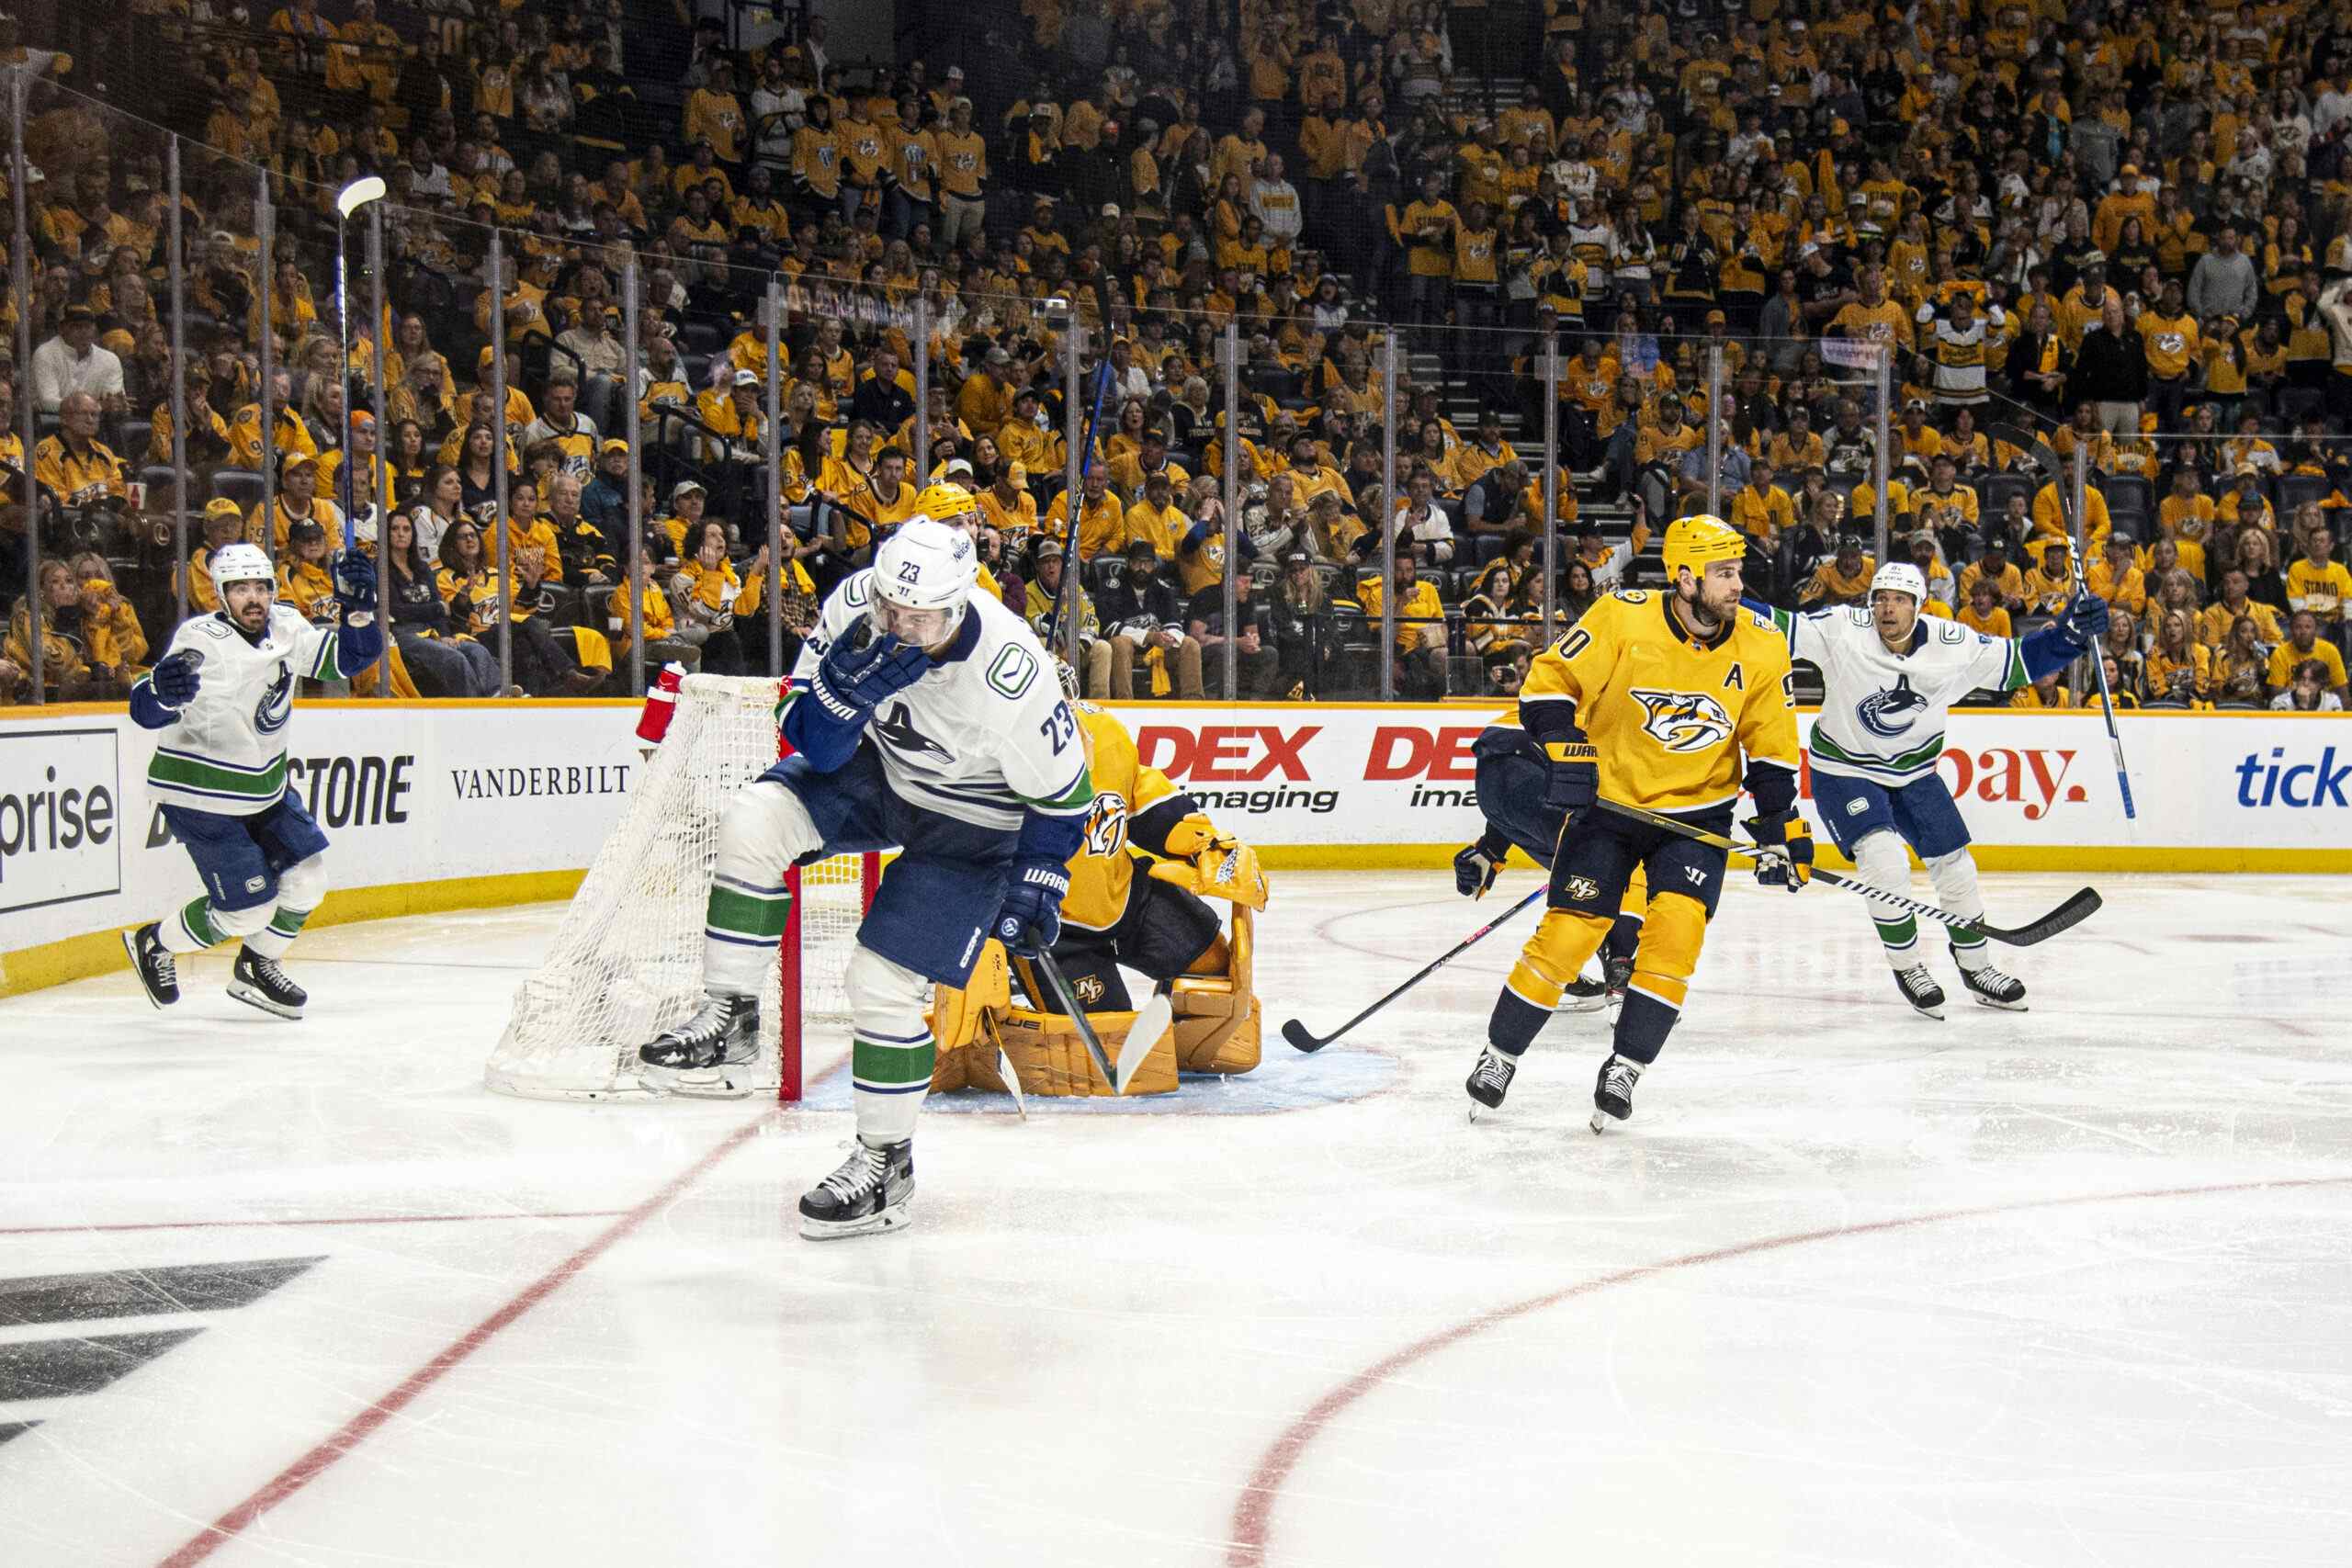
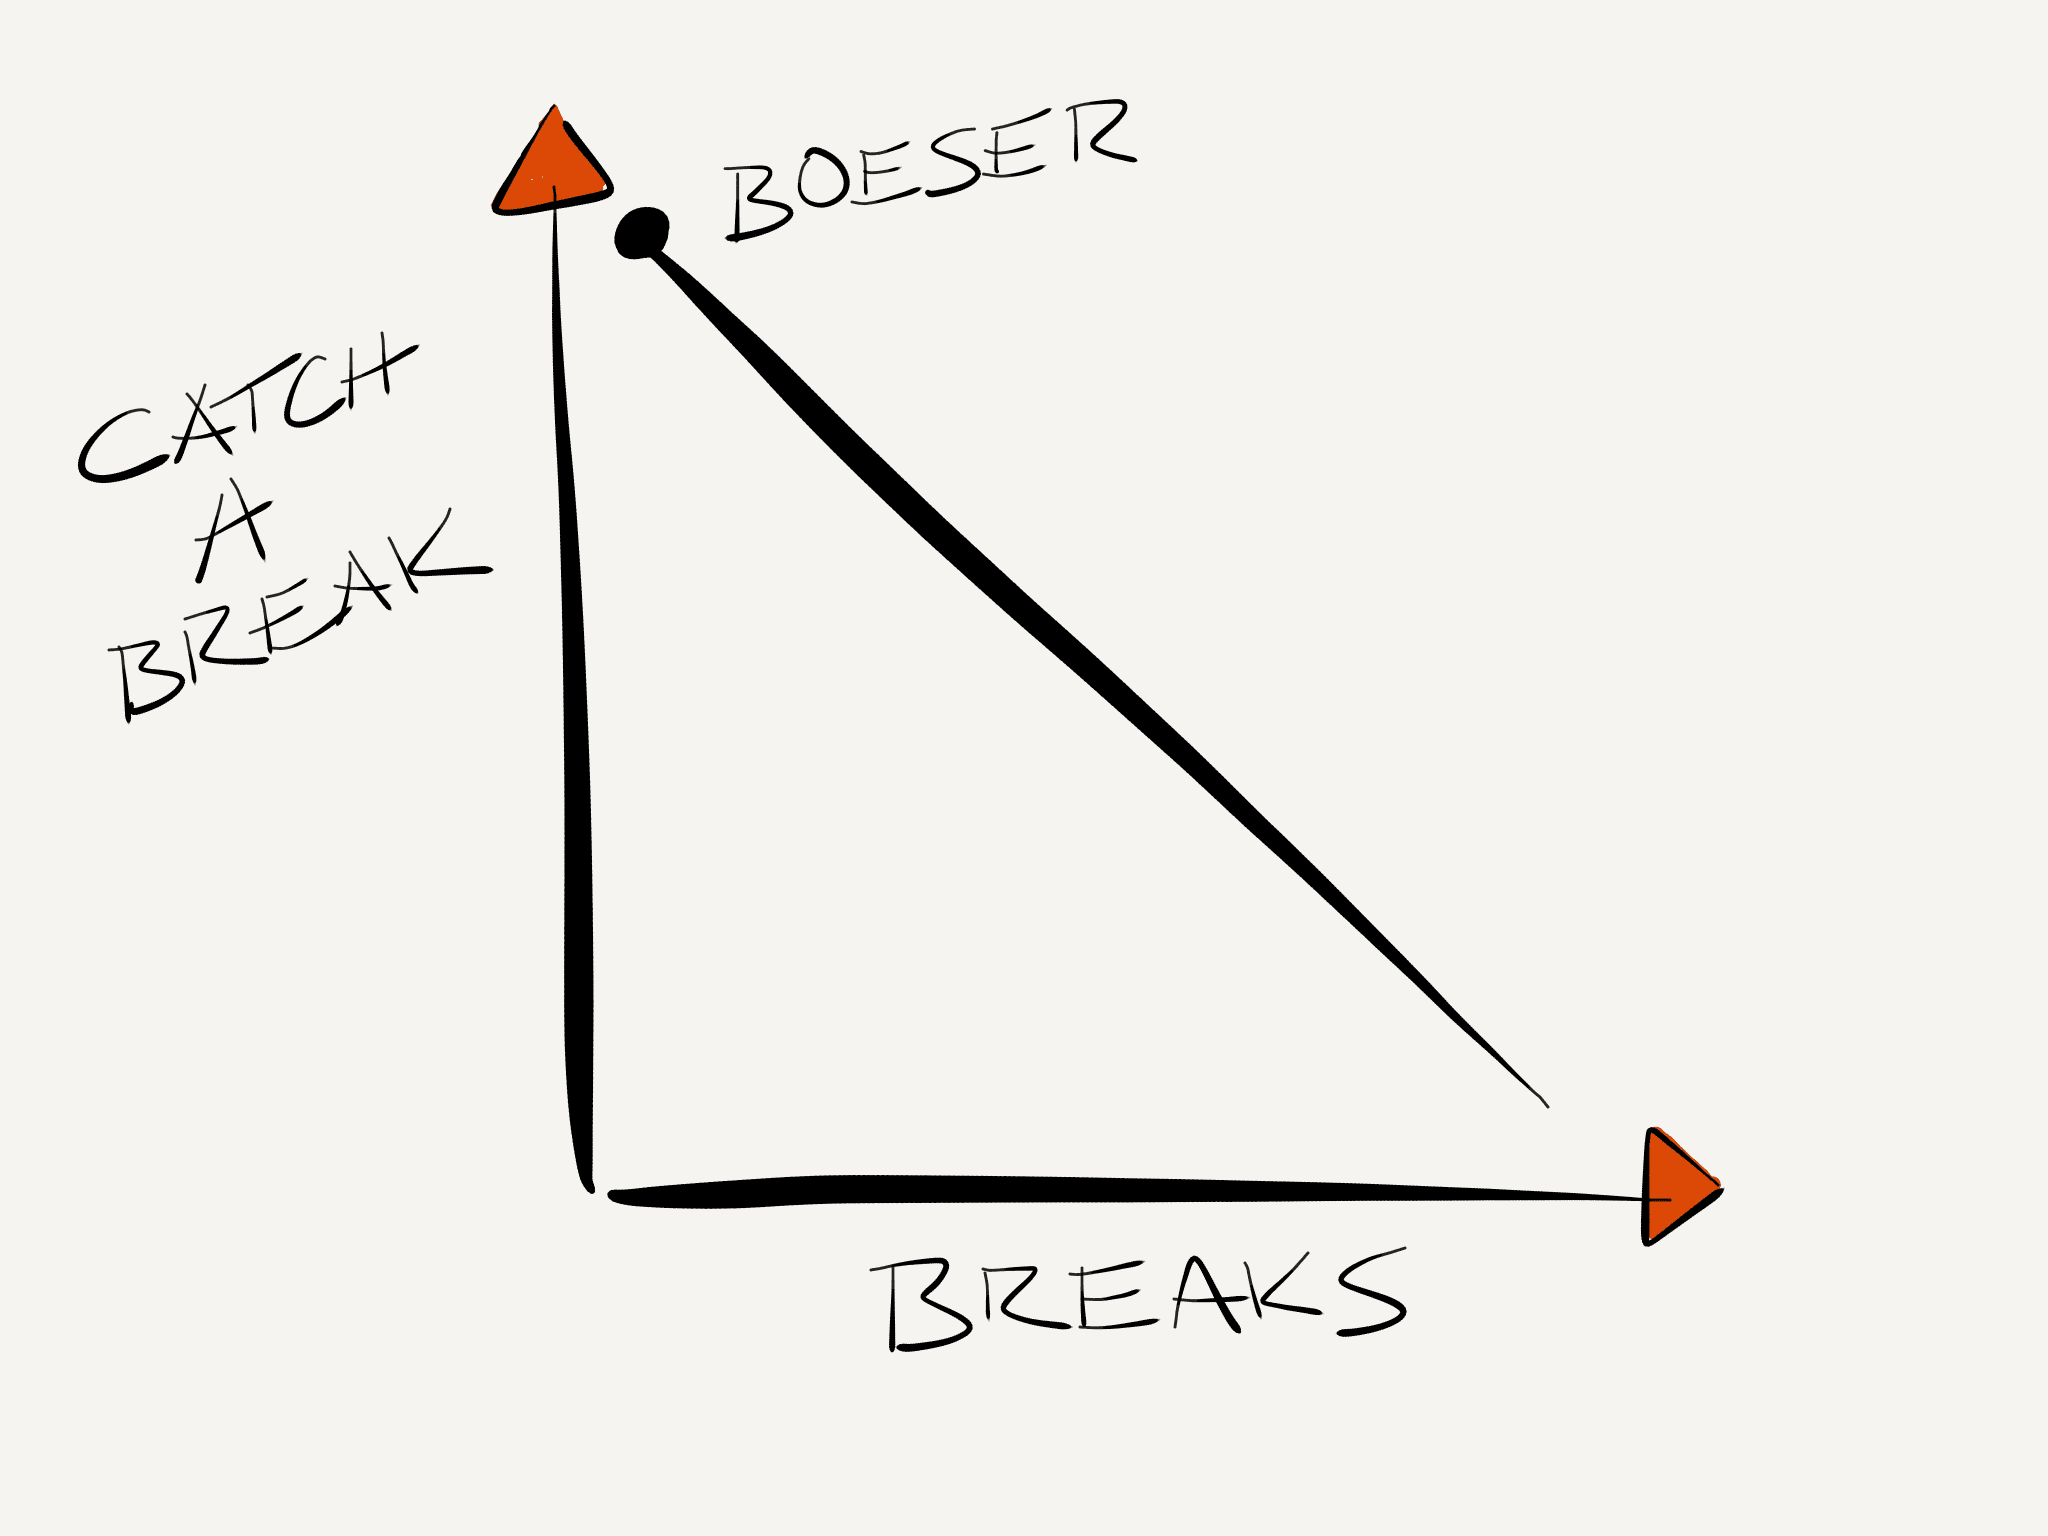
It looks like the Canucks finally caught a break on the injury front this week when it turned out that Brock Boeser didn’t break his foot doing what Jacob Markstrom couldn’t do: blocking a Mark Giordano shot.
Despite a collective sigh of relief from Canucks’ fans and organization alike, that bit of good luck runs counter to the spate of injuries to some of the team’s more prominent members. As JD outlined earlier this week, by one measure the Canucks have suffered the most impact due to injuries so far this season.
But can we actually see that impact on the team’s on-ice performance? Let’s dig into some numbers and find out.
First, a word about goal differential. Whether expressed as an actual +/- differential or as a percentage, goal differential correlates very well with standings points. Even just looking at 5-on-5 goal differential, you get a pretty good proxy for the final standings, and who will make the playoffs in any given year:
2016-17 Standings, sorted by 5v5 Goals For %
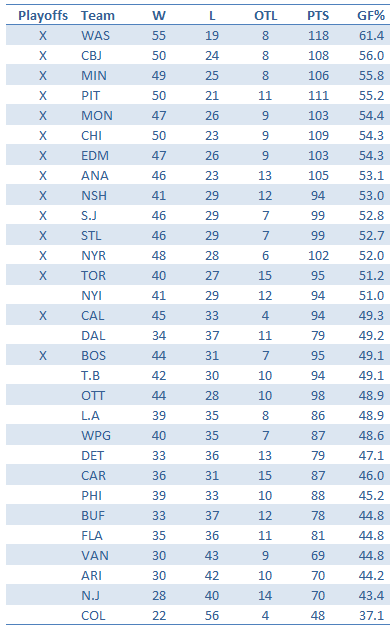
Goal differential on special teams definitely affects the ordering a bit, but over small samples, the variability in special teams can really skew things one way or the other. So when looking at in-season performance, it’s usually best to focus on 5-on-5 situations, which provide a much more stable view on the metrics. And if you want to look at how performance is changing during a season, it’s also good to use 5- or 10-game rolling average in order to smooth out any game-to-game variability.
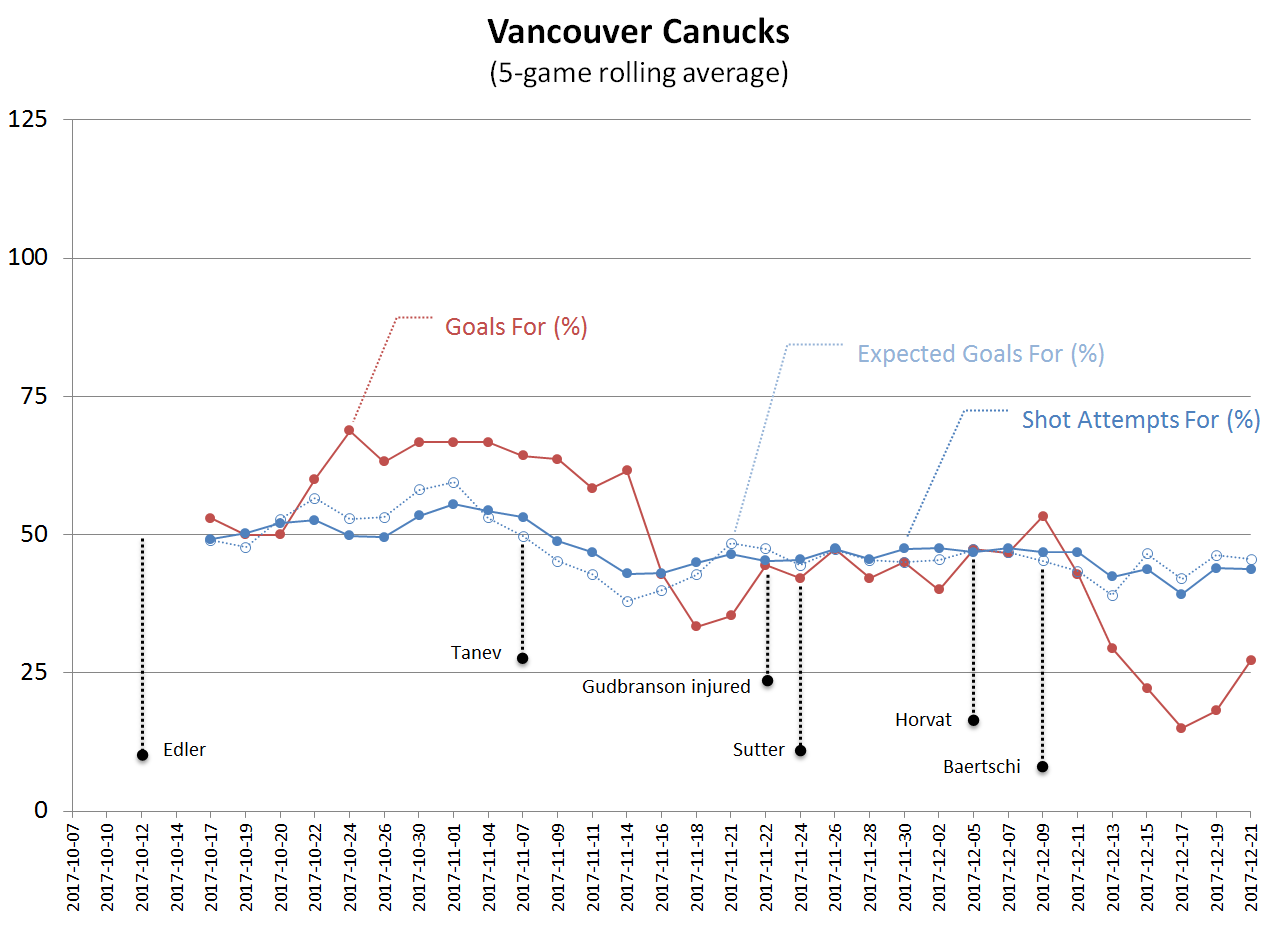
With that out of the way, let’s look at how the Canucks have fared through the various injuries that have endured so far this season.
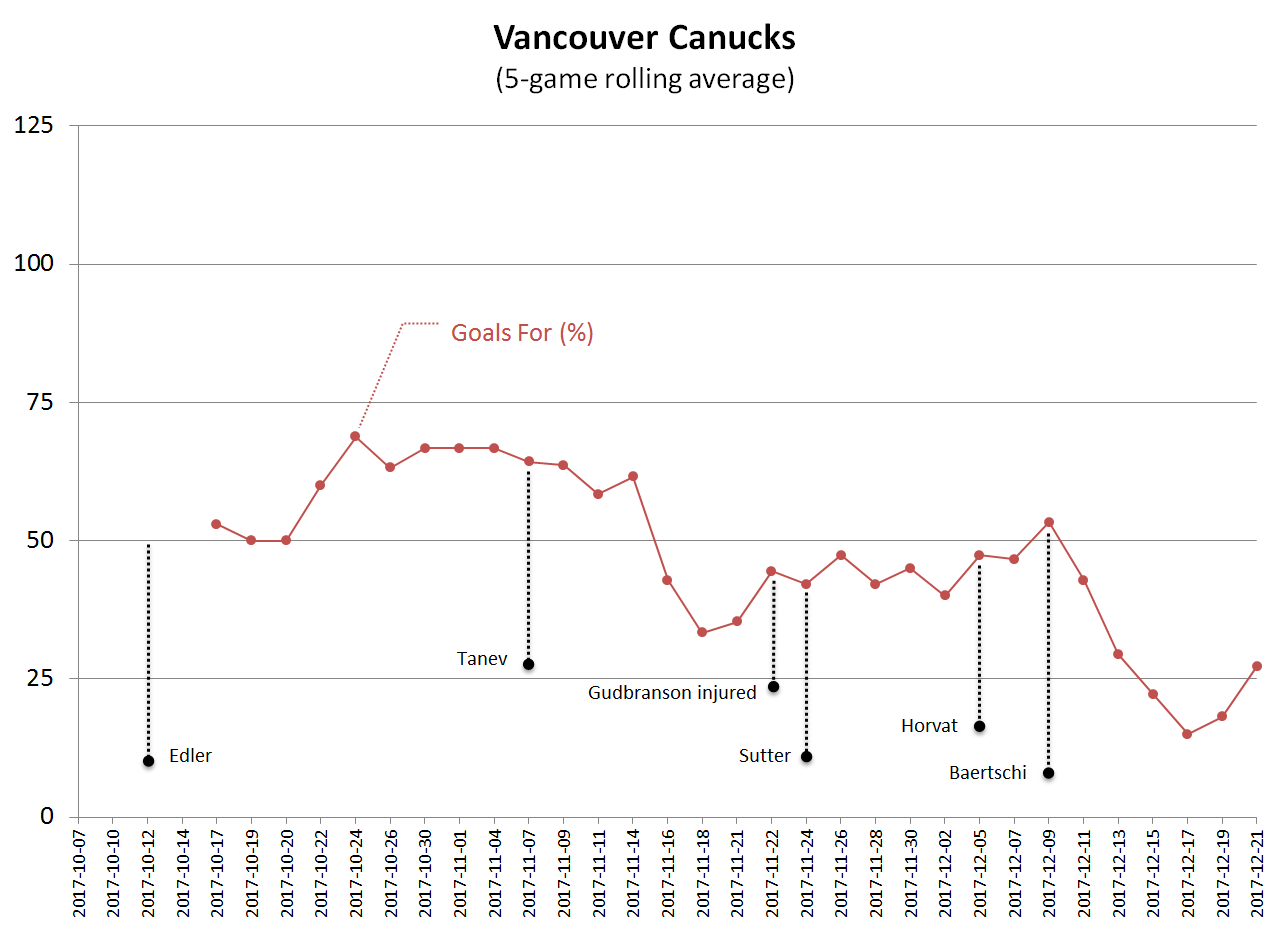
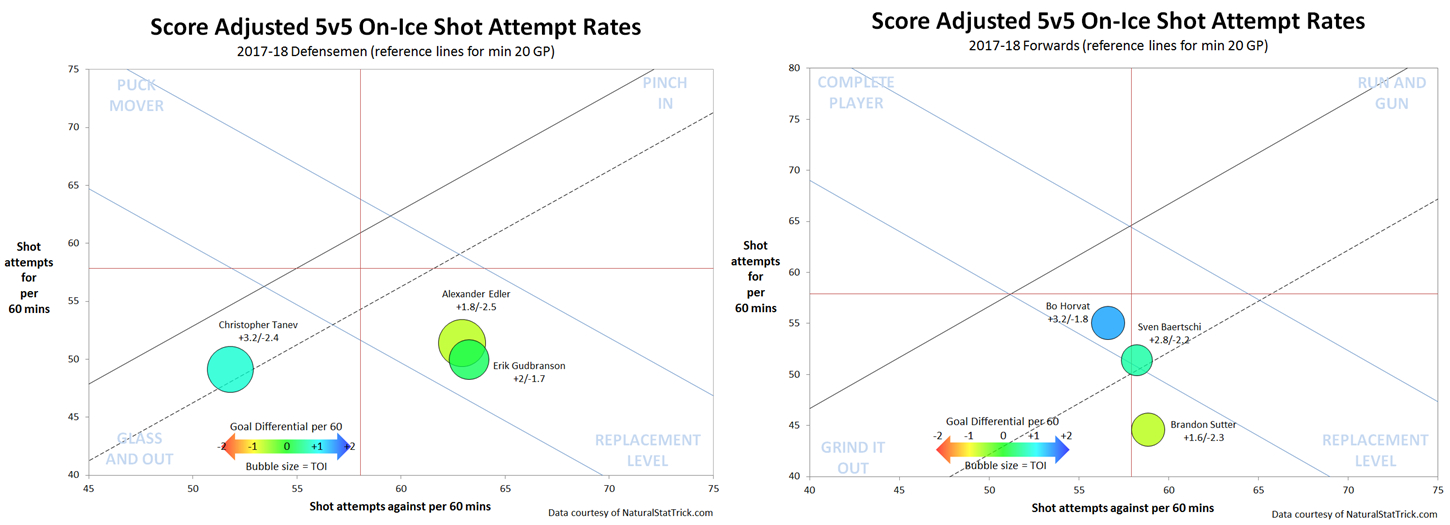
Looking solely at goals for and against, it’s fairly evident that losing Edler, Gudbranson, and Sutter had little to no negative impact on the team at 5-on-5. If anything, you could argue that losing Edler actually helped the team given that it was just after he rejoined the team on Nov. 11 that their goal differential dipped below 50%. Of course, this also coincided with Tanev being out of the lineup, and I think everyone understands his importance on the Canucks’ blueline. So it’s safe to say it was more likely his absence, rather than Edler’s return that contributed to that dip. The next big dip, which they are just now starting to climb out of, coincides with the injuries to first Horvat and then Baertschi.
So looking at the bottom line results, it does appear that the Canucks have been negatively impacted by the injuries to Tanev, Horvat, and Baertshchi, at least. Gudbranson, Sutter, and Edler, however, appear not to have been missed and were apparently easily replaced. It’s almost as if you could call them, replacement level…
But I digress.
While we have looked at this regarding goals, this wouldn’t be Canucks Army if we didn’t look at the underlying numbers as well. Sure, scoring more goals than the opponent is how you win hockey games, but bounces happen. If you don’t believe me, just go back and look at that Nashville game.
And because goals are few and far between, unless you’re playing the Canucks of late, it’s better to rely on shot attempts as an indicator of a team’s performance. Think of shot attempts like you would the amount of ore coming out of a gold mining operation. The amount of gold produced will be proportional to the tonnage of ore mined. But if all you did was count gold nuggets for a day, your estimate of the potential production from that mine could easily be skewed by the conditions you were mining in that day.
I’m sure some of you still aren’t convinced. Well, before you start complaining about ore quality in the comment section, let me layer on one more thing. Every shot attempt has some probability of being a goal. We can estimate those probabilities based on a variety of factors, including shot type, distance, angle to the net, rebound, on the rush, etc. If we apply those probabilities to each shot attempt, we get an estimate of the number of goals that we would expect to be scored. You’ll see this referred to as Expected Goals or xG, and Manny Elk has an explanation of how he calculates them on Corsica.
Back to our gold mine example, this would be like having more information on the geological composition of the ore we were mining. If we applied our estimate of ore quality to the amount of ore being mined, we would get an even better idea of how much gold would be produced over time. Again, the amount of gold produced on any given day would still vary, but the measures of the process would provide us with a better indication of how much gold would be produced in the future than simply projecting based on the daily output.
So if a hockey team is a goal scoring operation, shot attempts and expected goals are a measure of the process.
Now, let’s have a look at how the Canucks’ injuries have impacted on the process:
Again we see that the injuries to Edler, Gudbranson, and Sutter had little to no impact either way. The Tanev injury did precede the Canucks slip under 50% on shot attempts, but the downward slide on expected goals had already started a couple of games earlier. Even when he returned to the lineup on November 24, there was very little change in either shot attempts or expected goals with him back on the roster.
Horvat and Baertschi, on the other hand, looked like they were being missed, but the initial drop as stabilized over the last few games, even if the results, in terms of goal differential, have been terrible.
In fact, if we focus on the underlying numbers, the Canucks have been fairly consistent over the last month:
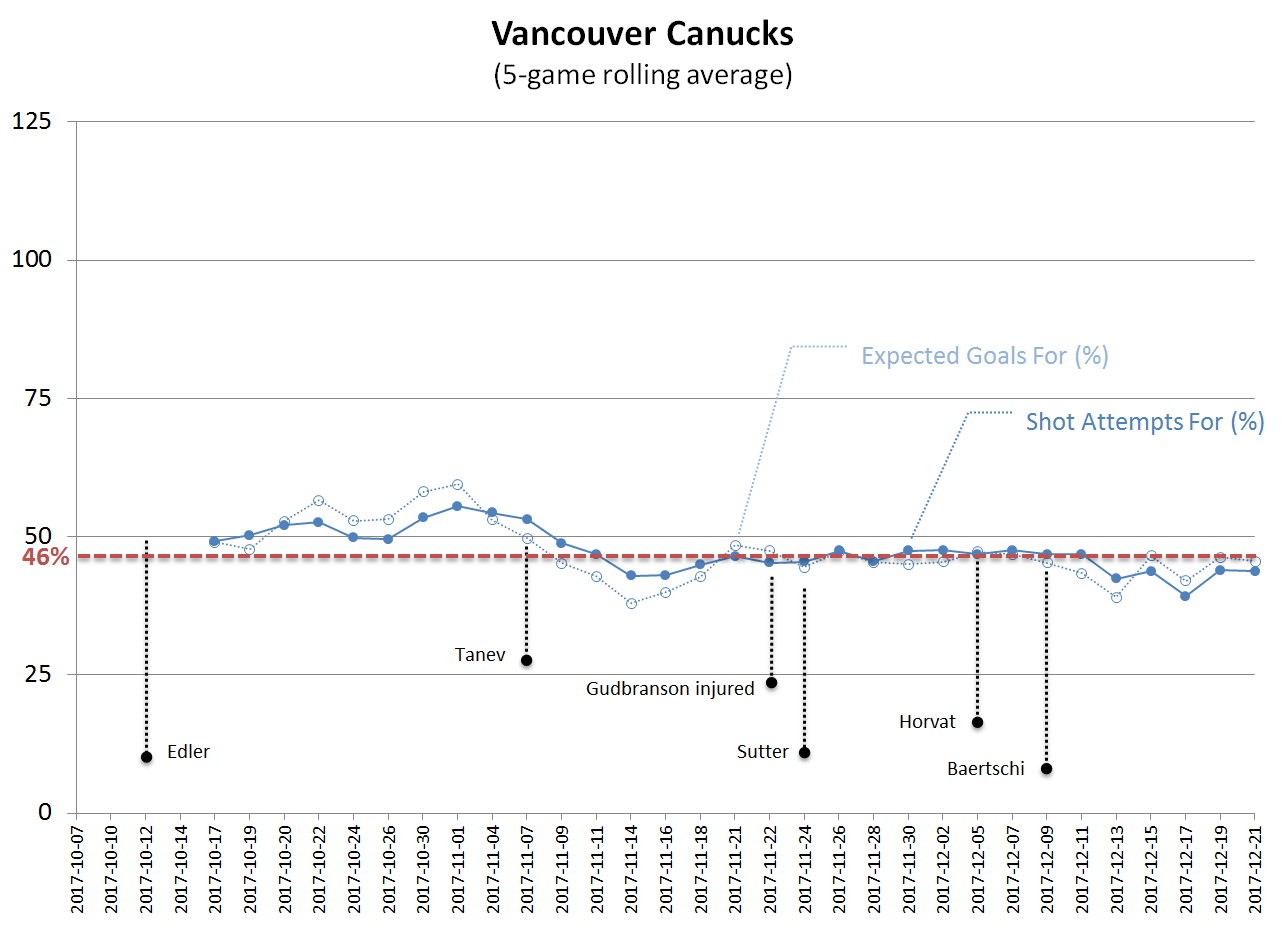
Yes, there was a dip when Tanev first went down, and also with the loss of Horvat and Baertschi, but the team appears to have found its level at the 45-48% mark in terms of expected goals for. And if you look at the final standings from last year, you’ll see that at level, they would finish the season 20-25th overall, and well out of the playoffs.
So yes, injuries have hurt the Canucks, a little bit. But they are not the cause of the team’s struggles of late.
If you want to blame anything, blame a run of bad luck.
PDO is a rough measure of how much luck and bounces have impacted a team’s results. It is simply the sum of shooting percentage and save percentage, and over longer periods of time it trends toward 100. If a team is over 100, they’ve benefited from the bounces, and if it’s under 100, they’ve been hurt by them.
Here’s how it looks for the Canucks with the same 5-game rolling average:
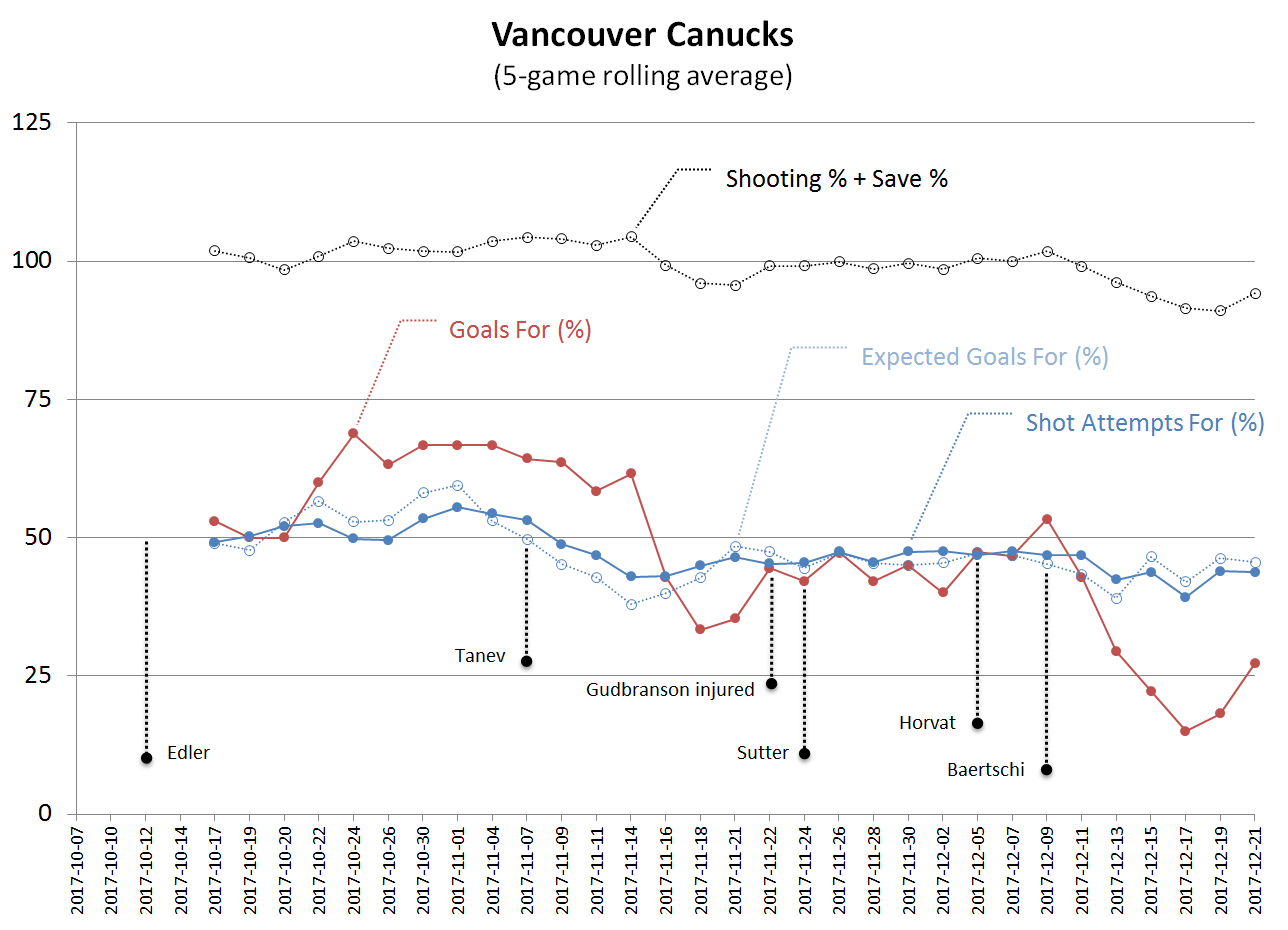
It’s pretty clear that much of the Canucks’ early success benefited from inflated percentages. Similarly, the current scoring problems can be largely attributed to a deep run of bad luck.
If I strip out some of the extra data in this chart, it’s even more evident how PDO explains the difference between expected goals, which is based on the average probability of goals being scored, and actual goals scored:
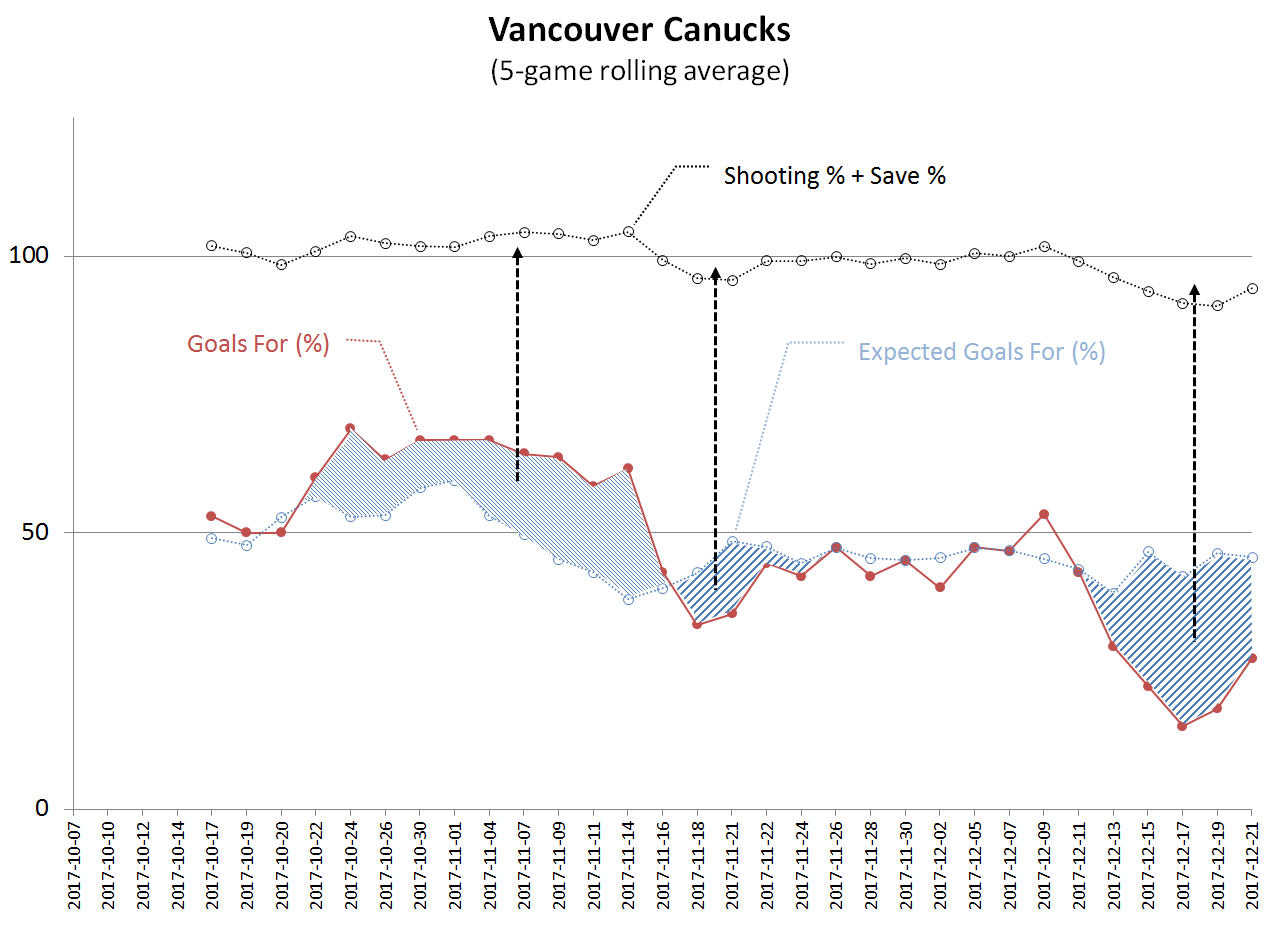
As PDO increases above 100, the goal differential is higher than expected, and when it dips below 100, the differential is lower than expected.
So the Canucks are not as good as the first half of November would indicate, and they’re not as bad as the last five games would indicate either. The truest measure of this team is are the ten games from November 22 to December 11. Unfortunately, that was not exactly a stellar stretch for this team, and injuries had little to do with it.
So, if injuries haven’t really had as much of an impact on the results as some people might think, is there anything else that could be contributing to the poor outcomes?
I’ve done a lot of work looking at the pace that teams play at in the past, and have come to the conclusion that weaker teams are better off playing at a slower pace. Pace, in this case, is defined as shot attempts for plus shot attempts against per 60 minutes of 5-on-5 time, and it’s a rough measure of how much action is taking place. The higher the pace, the more shot attempts, and the more trading of chances at both ends of the ice.
If you break the Canucks season into five-game increments and plot the average pace over those five games to the average goal differential at 5-on-5, it looks like this:
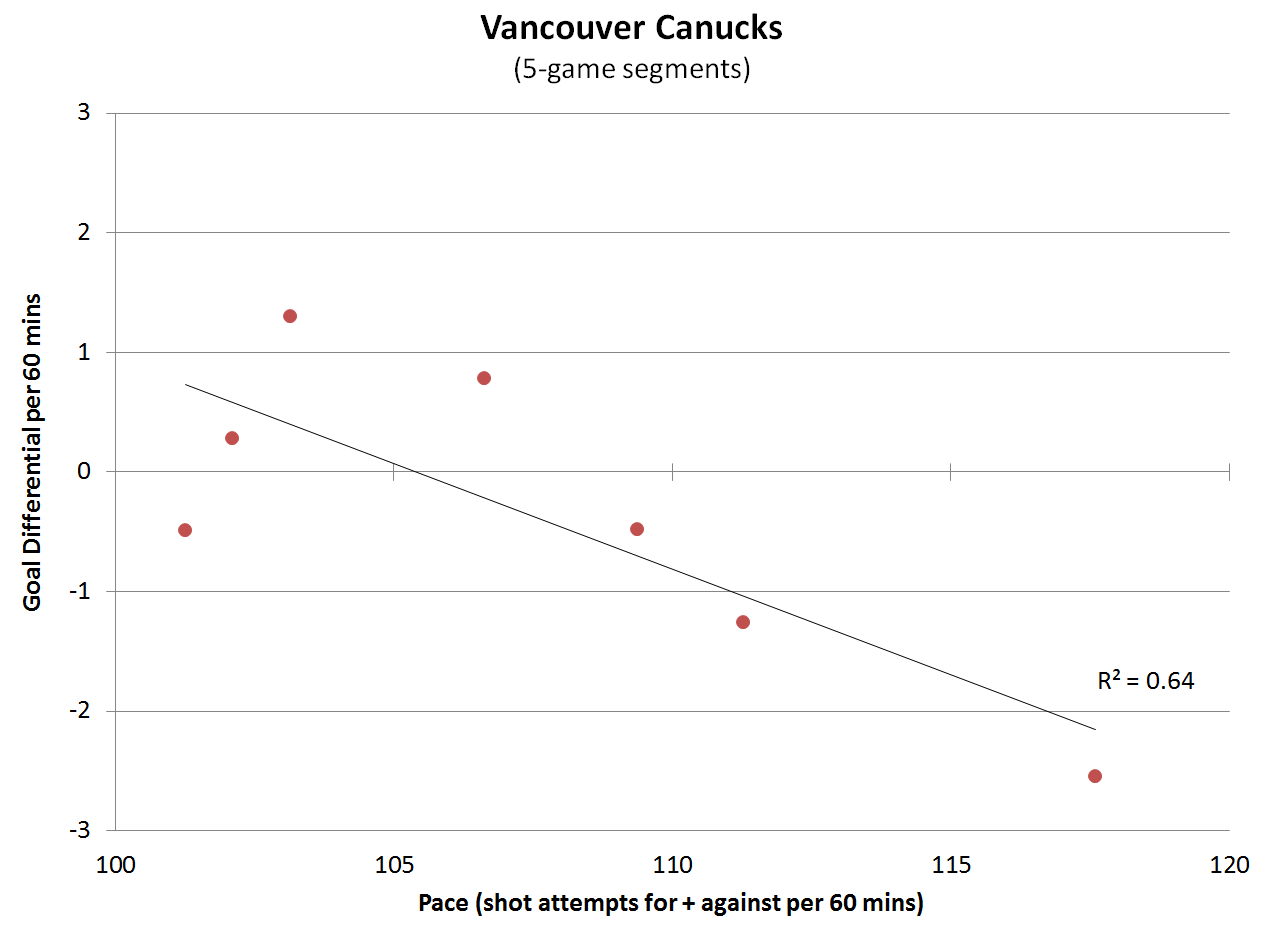
It is clear that the faster the game, the worse the Canucks have done.
And for most of the season, the team had been playing in the 100-110 events per 60 minutes range, and basically broken even in terms of 5-on-5 goals. But the last five games have been played at a blistering 117 events per 60 minutes. The result has been ungood.
The bottom line is this: injuries do not appear to have had much of an impact on the underlying numbers, and the poor results of late are more readily explained by bad bounces (exemplified by a very bad PDO) and this team playing a style that it does not have the horses for.
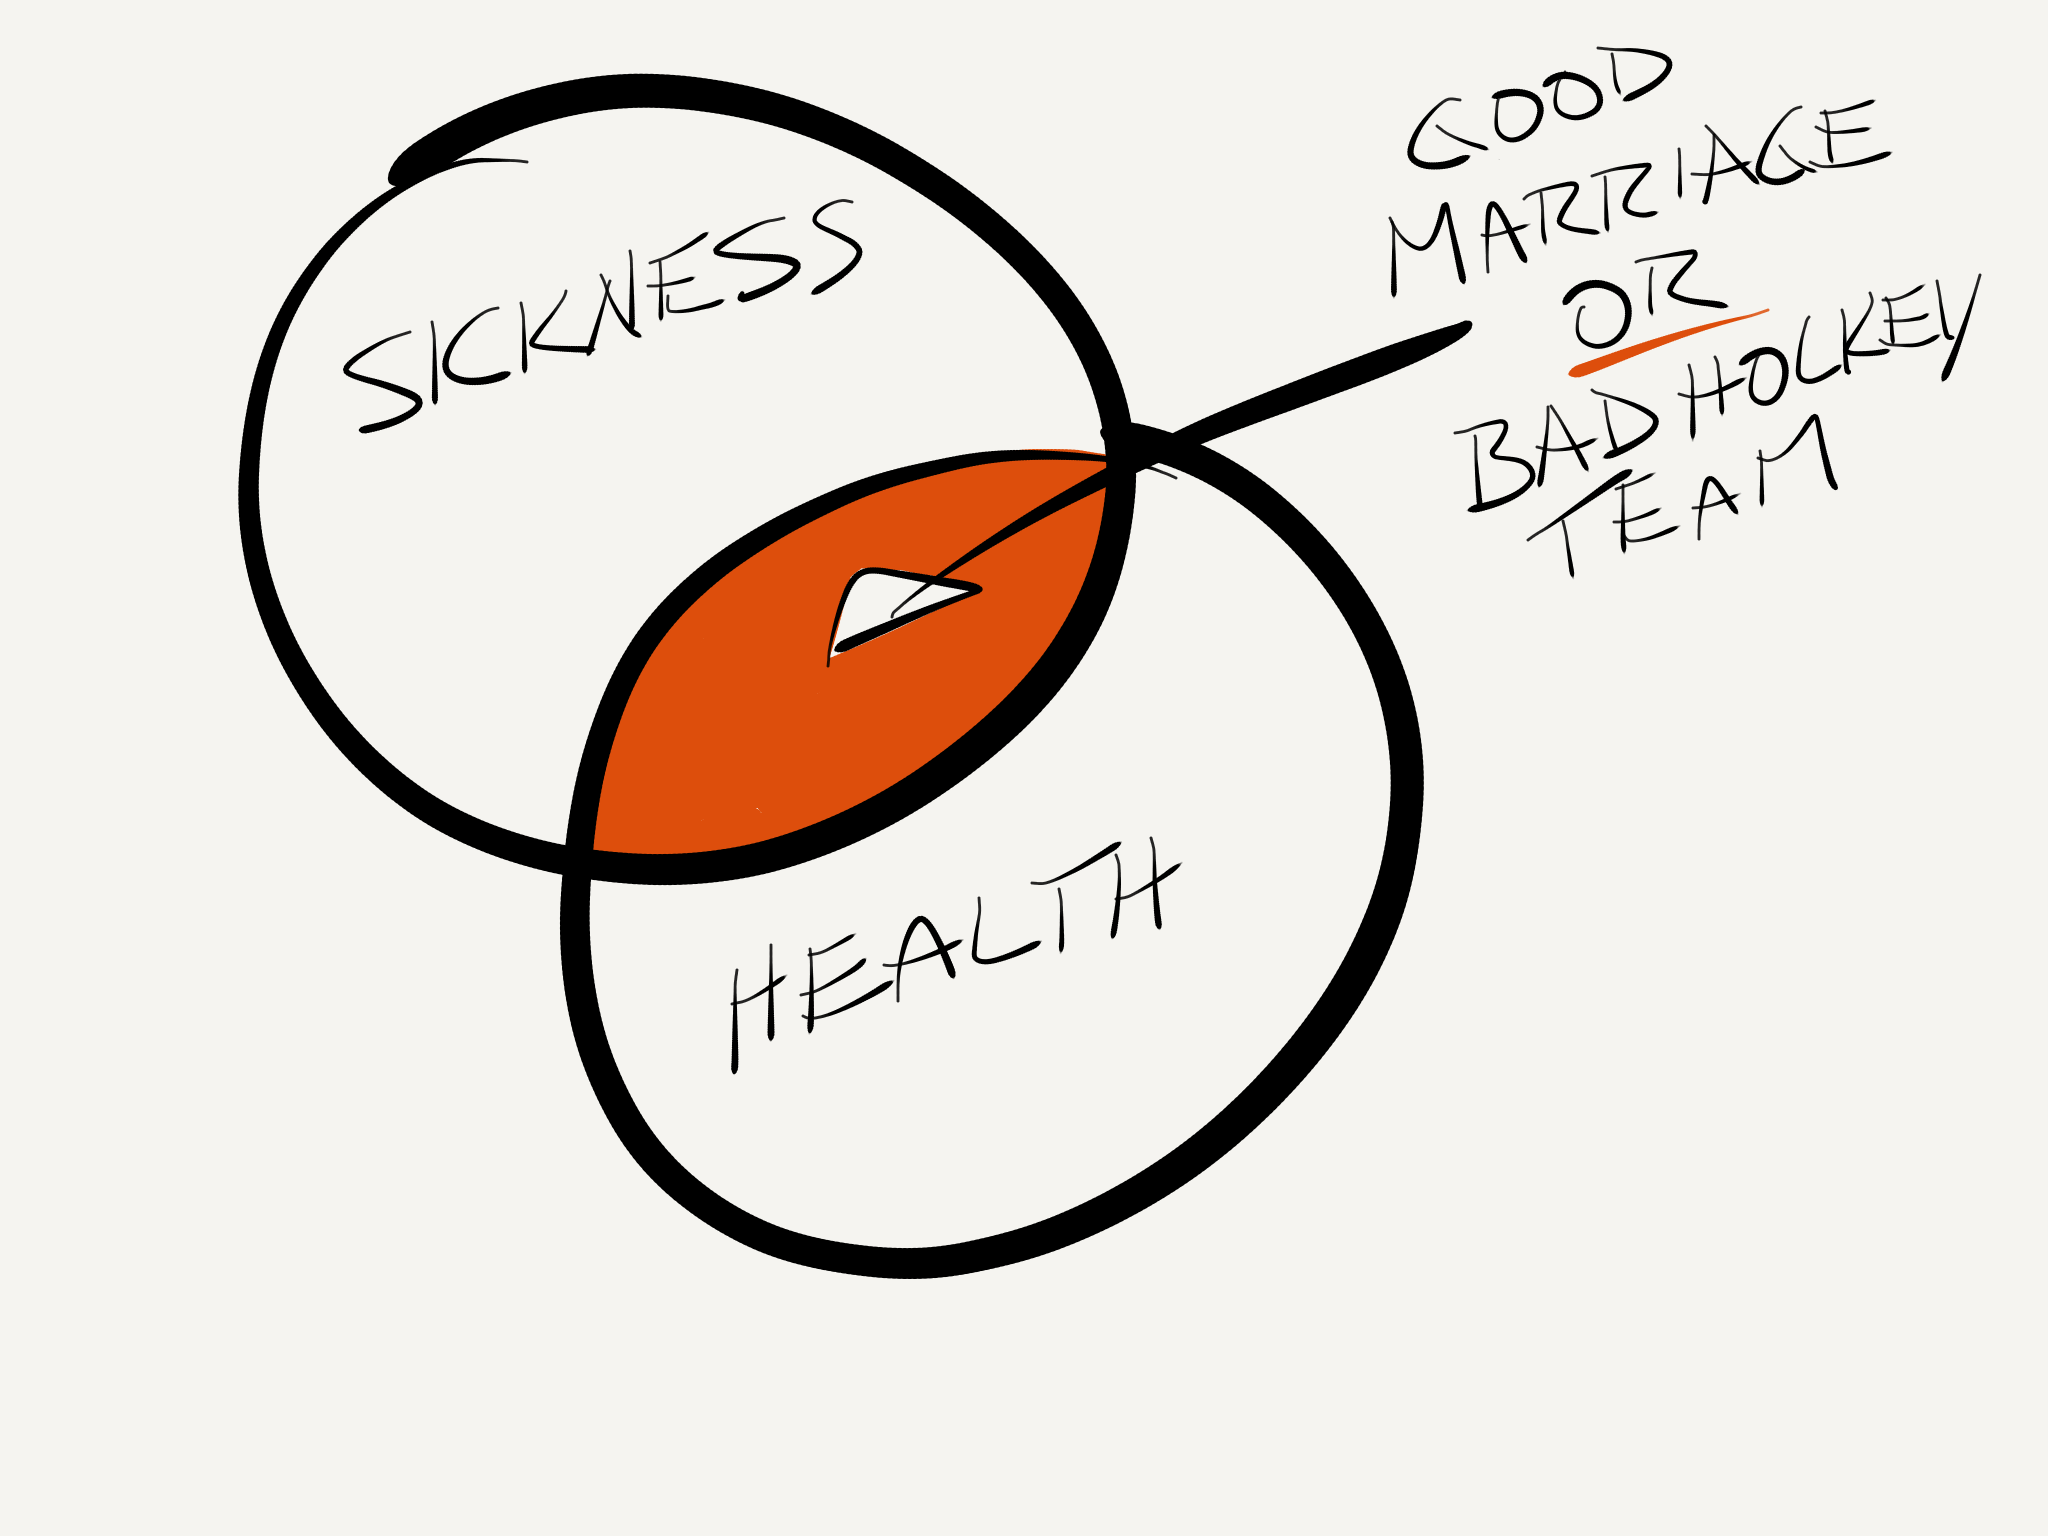
But while everything staying the same whether in sickness or in health might be the sign of the a good marriage, if your hockey team is the same even when you lose a couple of “foundational” players, it’s probably not a good team.
RECENT GRAPHIC COMMENTS
Recent articles from Graphic Comments