


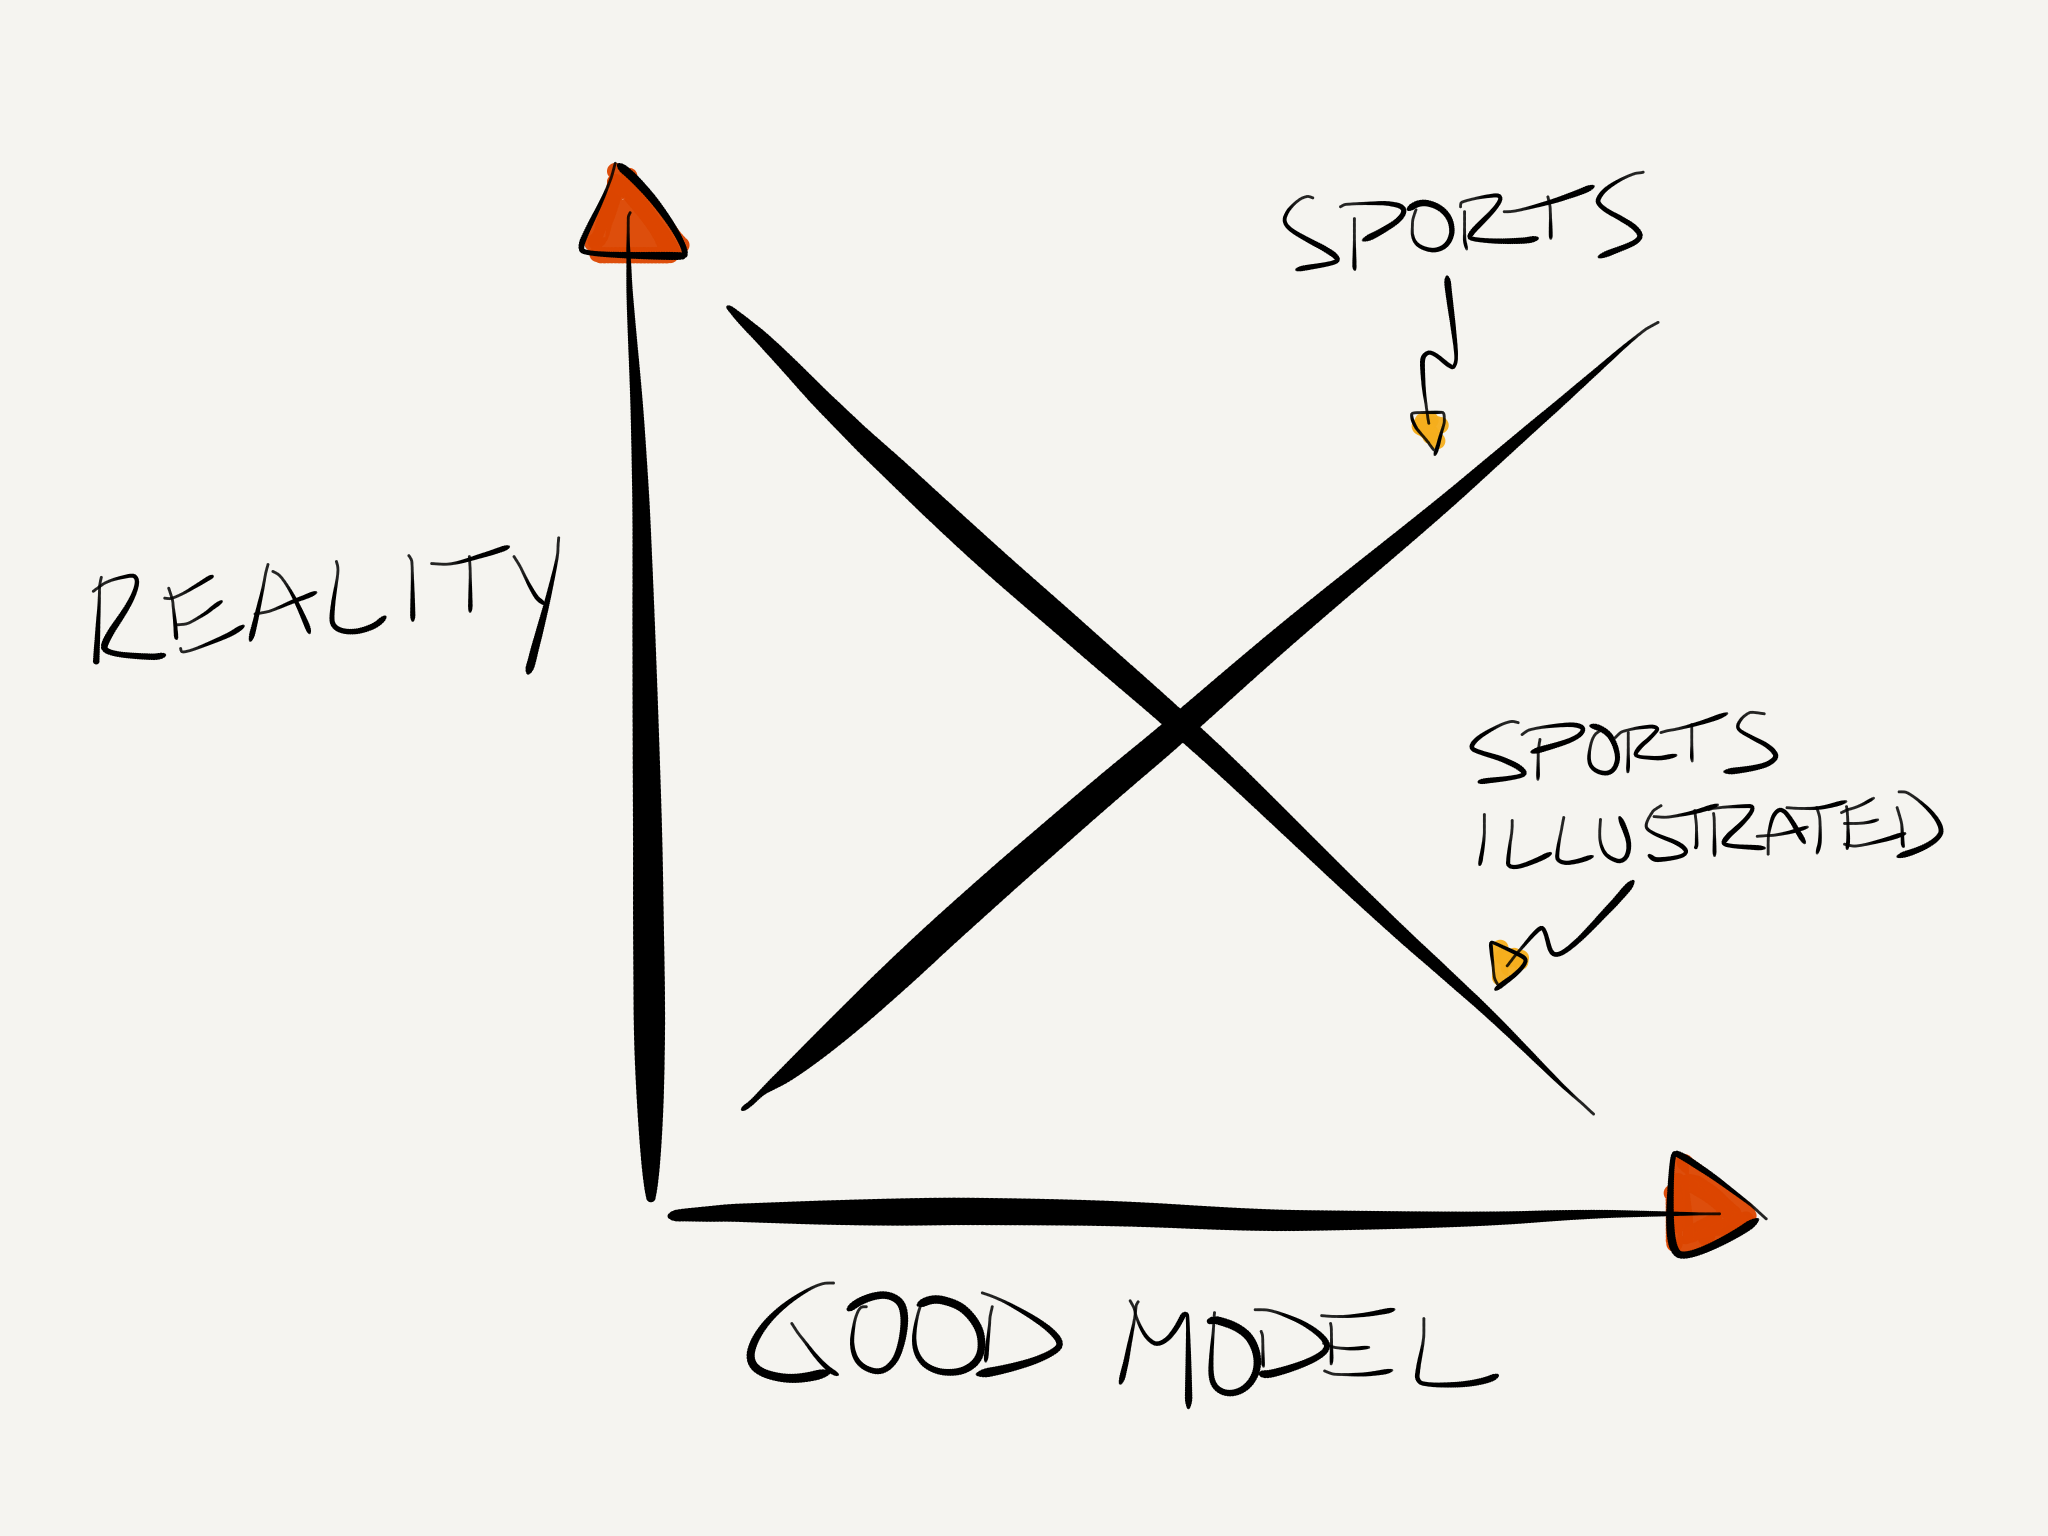

When it comes to models, you typically want one that replicates reality as closely as possible. Unless you’re the editor for the Sports Illustrated swimsuit issue, I suppose.
But hey, we’re not here to discuss the fantasies of teenage boys. This is about the on-ice reality of NHL hockey and how best to analyze it. And the methods and models used to do that are getting more and more complex.
It’s been over four years since I wrote a really basic guide to advanced hockey stats right here at Canucks Army, and boy have things come a long way since then. In that time we’ve moved from shot attempts (Corsi/Fenwick) to scoring chances (SC) to expected goals (xG), and now can combine a variety of factors to estimate overall value of players in terms of Goals (GAR) or Wins Above Replacement (WAR).
But we’re not here to talk about those either. We’re here to talk about models used to predict the outcome of hockey games. And in particular, we’re here to talk about Edgar.
Edgar is the model Micah Blake McCurdy (@IneffectiveMath) built to simulate the 2017-18 NHL season. “Simulate” is the key word here, and it’s the reason I thought it might be worth delving into this topic.
There are now quite a few models out there that combine a variety of statistical regression techniques to generate predictions. Actually, probabilities is probably a better term for what they generate. Prediction implies a binary, win/loss result. But in, er, simulated reality, there are no sure things. A model can only ever produce the probability of a win or loss. So while the input might be binary, in terms of 1s and 0s, the output will be a probability between 0 and 1:


Please tip your waitress, and try the veal.
Anyway, bad attempts at jokes aside, the difference between Edgar and most models produced to date is that Edgar is a bottom up simulation of events during a hockey game, rather than a combination of statistical regression techniques that was “trained” on a previous data set.
It works by estimating the patterns of shots that will be taken in a game and then simulating the result of those shots. This simulation approach makes it completely different from my past models, which are all essentially statistical. Edgar contains no parameters that are obtained from any statistical algorithm; that is, it is not “trained” by optimization of any function. You should think of Edgar as a “model” of hockey like you would think of a wind-tunnel carving as a model of a race car or of the theory of gravitation as a model of planetary movement: that is, as a simplified version of something which interests us.
That last sentence is the key. With a simulation, we now have a model whose outputs are based on directly on the interaction between empirical observations and the constraints and parameters of a hockey itself. This type of model then allows you to better test different hypotheses because you are applying them to a representation of a hockey game, rather than relying on a statistical representation of similar situations that occurred in the past and trusting them to predict the result. As with the scale model in a wind tunnel example above, simulation models will allow us to change certain input parameters in isolation, like, say, shot locations or shot rates, to test which has a bigger impact on results. Statistical models will always have limitations because of confounding factors affecting both inputs and outputs. It would be like trying to determine the best design for the spoiler on a race car by looking at lap times in real races for various cars.
All that being said, it is important to remember this much quoted aphorism:
All models are wrong, but some are useful.— George Box
And yes, if there’s one thing we can be sure of, it’s that Edgar, like all models, will be wrong a lot of the time. In fact, Corsica has a running tally of game-by-game model predictions going for this season, and Edgar is currently in 15th in terms of overall accuracy, a couple of spots below the Average prediction of all the models for each game:

But that’s not to say that it is not useful. Keep in mind, this is Micah’s first iteration of a simulation model and we are only 15 games into the season, which means much of the input is still based on previous years’ observations. As this season gets past the 20-25 game mark, I would expect that . I’m sure the floggings will continue until performance improves.
Despite the less than stellar predictive performance, the neat thing about simulation models is that the error is often consistent, i.e. the same error will apply to all permutations of the simulation. So if you want to compare two things and are looking at the relative change in results, the error will often simply cancel out. There’s a very good chance the building you are sitting in right now was probably designed and built using an energy model that was similarly “wrong” in terms of predicting overall energy use. But when the designers use the model to compare different types of window systems, they can get a pretty good sense of the relative importance of one window vs another. It is exactly in this way that Edgar, and models like it, will eventually be very useful in analyzing hockey.
So, what does this all mean for the casual fan? Probably not a heck of a lot right now, but I expect that in the future this approach will provide us with some additional insights into how hockey works and which on-ice events are actually important.
Until then we are left with Edgar as the state of the art hockey simulation model, and this is what it told us about the Canucks coming into this season, together with actual progress through last night’s game (if you want to read more about CUSUM and this type of chart, I wrote about it last year on Hockey Graphs):

So far the Canucks are basically staying within a standard deviation of the predicted points coming into the season, and at this rate would finish near the predicted 86 point mark. Definitely not good enough for the playoffs, but maybe bad enough to sneak into the top 10 at the draft.
But where they actually wind up, well I guess we’ll just have to wait and see.
