
Nation Sites
The Nation Network
CanucksArmy has no direct affiliation to the Vancouver Canucks, Canucks Sports & Entertainment, NHL, or NHLPA
Comparing the 2024/25 Canucks after 10 games to last year’s team at the same mark
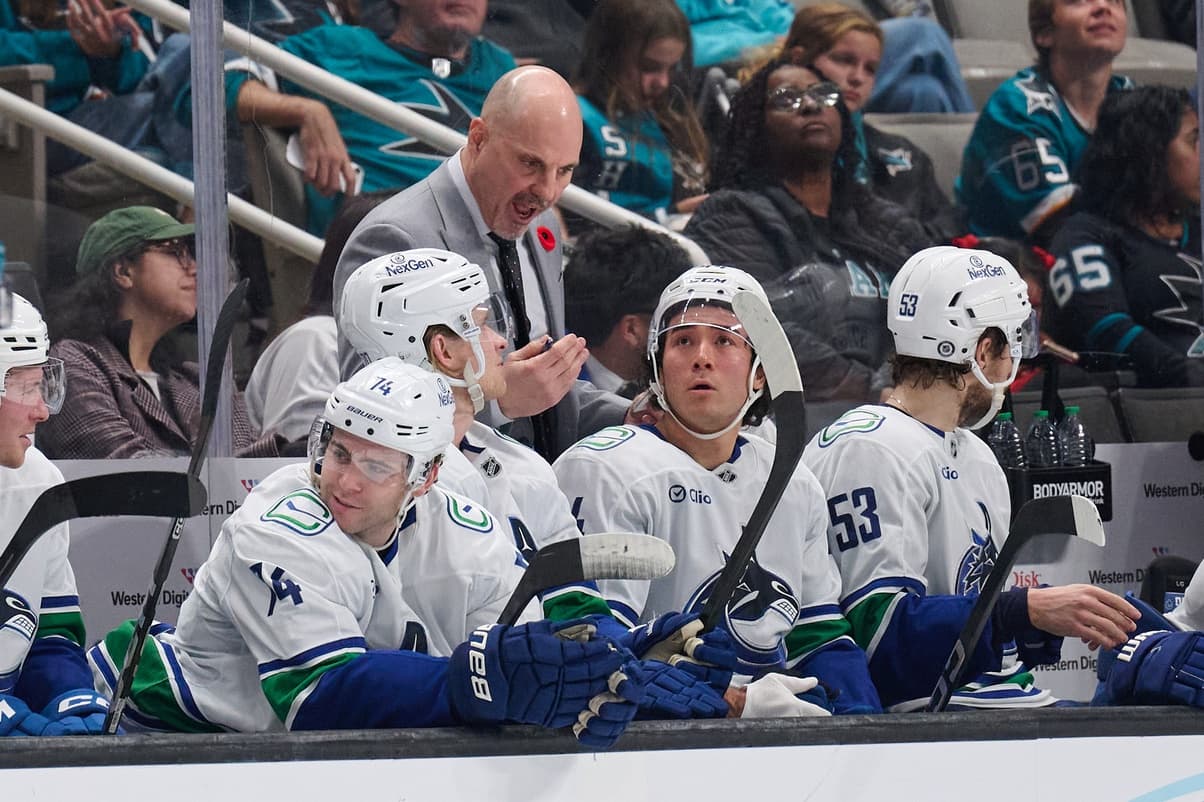
Photo credit: © Robert Edwards-Imagn Images

Nov 5, 2024, 11:00 ESTUpdated: Nov 5, 2024, 21:54 EST
Saturday night’s dramatic win over the San Jose Sharks might have been the most narratively exciting game of the young 2024/25 season thus far for the Vancouver Canucks. It also marked their tenth game of the year, which is as nice a checkpoint as any at which to do some analysis in our frequently base-ten society.
So, we decided to throw the 2024/25 Canucks and their first ten games up against the ‘rival’ that these Canucks have been and will continue to be compared to all season long: the 2023/24 Canucks.
Here’s how both editions of the team compare at the ten-game mark.
The Record
2023/24 Canucks: 7-2-1 (15 points)
2024/25 Canucks: 5-2-3 (13 points)
For all the ballyhoo about the Canucks’ slow start, especially comparatively to last year’s start, it’s important to remember this context: this season’s Canucks are only two points behind last year’s pace.
There’s a lot more to it than that, as we’ll see in the sections to come. But there’s also…not. In the end, a two-point gap is nothing this early in the season, and something that can definitely be rectified later. So long as some of the other discrepancies can be cleared up, too, that is.
The Offence
2023/24 Canucks: 46 goals for, 4.60 per game (1st in NHL)
2024/25 Canucks: 30 goals for, 3.00 per game (18th in NHL)
For all the talk of defence, the Canucks’ offence has also taken a considerable tumble through ten games, down 17 spots from first to 18th. The Canucks are down more than a goal-and-a-half per game.
Now, nobody was really expecting them to replicate last season’s blistering pace. Those were ‘80s-era Oilers numbers that never could have lasted forever.
But this much of a drop? This is a story that probably needs as much attention as does the other end of the ice.
The Defence
2023/24 Canucks: 22 goals against, 2.20 per game (4th in NHL)
2024/25 Canucks: 32 goals against, 3.20 per game (21st in NHL)
If there’s a positive to be found here, it’s in the parallel. At least the Canucks have fallen an equal 17 spots in both offence and defence. They’ve also picked up a whole extra goal against per game, which could be attributable to a lot of things, but is probably mostly attributable to what is clearly on display on the ice: the Canucks just aren’t defending as well this year as they were last year.
First Ten Opponents
2023/24 Canucks: Edmonton, Edmonton, Philadelphia, Tampa Bay, Florida, Nashville, St. Louis, New York Rangers, Nashville, San Jose
2024/25 Canucks: Calgary, Philadelphia, Tampa Bay, Florida, Philadelphia, Chicago, Pittsburgh, Carolina, New Jersey, San Jose
We don’t really have ‘strength of schedule’ stats to compare this early into the season. We just have a list of names. But we included this section just to demonstrate that the Canucks have been playing against, roughly, the same calibre of opponents through their first ten games this year as they did last year. In some cases, it’s the exact same teams. And if we’re picking the stronger set of the two, it’s probably the 2023/24 opponents with 7/10 of those teams eventually making the playoffs.
This removes at least potential ‘excuse’ for the Canucks’ diminished returns in 2024/25.
Shooting Percentage
2023/24 Canucks: 13.5% (1st in NHL)
2024/25 Canucks: 9.96% (11th in NHL)
Here’s a bit of an excuse that could work, on the other hand. With the 11th-best shooting percentage in the NHL right now, nobody would argue that the Canucks are getting bad puck-luck. But in comparison to last year’s team, which was one of the puck-luckiest teams in the NHL in the early going, the statement must stand.
What this could be taken as indicating is that last year’s Canucks weren’t that much better at putting up offence than this year’s Canucks, but rather luckier in seeing a greater percentage of their shots going in.
The actual truth is probably some blend of both.
Save Percentage
2023/24 Canucks: 94.86% (3rd in NHL)
2024/25 Canucks: 90.05% (21st in NHL)
For as much as the Canucks’ offence, defence, and shooting have crumbled between the first ten games of 2023/24 and the first ten games of 2024/25, no statistical category has seen a greater fall than that of team goaltending.
Call it reverse-puck-luck, call it stellar netminding, call it whatever. The fact of the matter is that the Canucks received some of the best goaltending in the league in the early going last year, and bottom-third results thus far this year.
Obviously, this is a bit of a skewed stat, and it’s skewed by Arturs Silovs. Kevin Lankinen’s .919 save percentage is fifth-best in the NHL right now. Silovs is 69th (out of 71) with a .797 save percentage.
So, take this as something that has impacted the Canucks’ overall numbers, but perhaps don’t take it as a true reflection of the state of the crease right now.
PDO
2023/24 Canucks:1.084 (1st in NHL)
2024/25 Canucks: 1.005 (15th in NHL)
Since this was talked about so much last year, we’d be remiss not to mention it here. The Canucks’ PDO has gone from far and away the highest in the NHL to right smack-dab in the middle.
What does it mean?
Little, aside from the notion that this year’s Canucks are already a little more of what they truly are, as opposed to last year’s slightly-elevated numbers at this point (primarily brought on by that unruly shooting percentage).
The Power Play
2023/24 Canucks: 34.3% (2nd in NHL)
2024/25 Canucks: 16.1% (23rd in NHL)
The struggles of the power play have been talked about often enough that we won’t belabour the point here. But its success rate has been reduced by a factor of more than half, and that’s actually kind of staggering to see laid out like that.
Were this not the case, the Canucks’ current offence would no doubt be a lot closer to last year’s mark.
The Penalty Kill
2023/24 Canucks: 76.3% (19th in NHL)
2024/25 Canucks: 83.3% (11th in NHL)
Hey, finally something to celebrate. The Canucks’ PK might not quite be at ‘good enough’ for their competitive purposes, but it’s a darn sight better than it was at this point last year. And that’s with a lot of new personnel on the ice and those aforementioned occasional goaltending issues.
It’s something to build on, at the very least, and perhaps a good indicator of some eventual systemic improvements.
Hits
2023/24 Canucks: 235, 23.35 per 60 (10th in NHL)
2024/25 Canucks: 291, 28.65 per 60 (1st in NHL)
Let’s keep the positivity rolling for a moment with a stat we can only really refer to as ‘the Kiefer Sherwood Factor.’ Largely, but not entirely, on the strength of Sherwood’s ceaseless physicality, the Canucks are number one in the NHL in hits. And they’re doing it without last year’s hit leader, Dakota Joshua.
Once he gets out there, too, opponents should be shuddering.
Top Scorers
2023/24 Canucks: Elias Pettersson (19 points), JT Miller (16), Quinn Hughes (16), Brock Boeser (13), Filip Hronek (10)
2024/25 Canucks: Brock Boeser (9), JT Miller (9), Conor Garland (9), Quinn Hughes (9), Pius Suter (5) [tied with Blueger, Sherwood, Höglander, DeBrusk]
One last point of quick comparison, and it’s a bit of a doozy.
One of the fun things about the 2023/24 Canucks in the early going was that they were being led by the exact players you’d want them to be led by. The five highest-profile players on the team were the top-five scorers, each at a point-per-game or greater, and they were being adequately supported by the rest of the roster.
Not so in 2024/25. Now, nobody is at a point-per-game, and the drop-off from that top-four tie of Boeser, Miller, Hughes, and Garland to the conglomeration of seemingly random players tied at five points is notable.
The stats above show that, as a whole, the Canucks are not performing anywhere near as well through the first ten games as last year’s edition did. These particular stats here show that this can largely be attributed to certain individual performances.
Sponsored by bet365
Breaking News
- Abbotsford Canucks hire Ryan Papaioannou as new Head Coach
- Where does newly signed Mitchell Weeks fit in the Canucks’ goalie depth chart?
- CA’s top 20 Canucks summer prospect rankings: #19 Wilson Björck
- Analyzing Paul Cotter’s fit in the Canucks’ bottom six
- Alex Edler rejoining Canucks in player development role

Vancouver CanucksTeam Cap Summary

Cap Summary
2026-27
2027-28
Projected Cap Hit
$86,185,833
$62,923,333
Projected Cap Space
$17,814,167
$50,576,666
Current Cap Space
$17,814,167
$50,576,666
Active Players
23/23
13/23
Draft Picks
Round
'26
'27
1
2
1
2
2
2
3
1
1