On the Proper Use of “Real-Time Stats” or, Why We Don’t Use Blocked Shots to Judge Player Performance

By Cam Charron
12 years ago
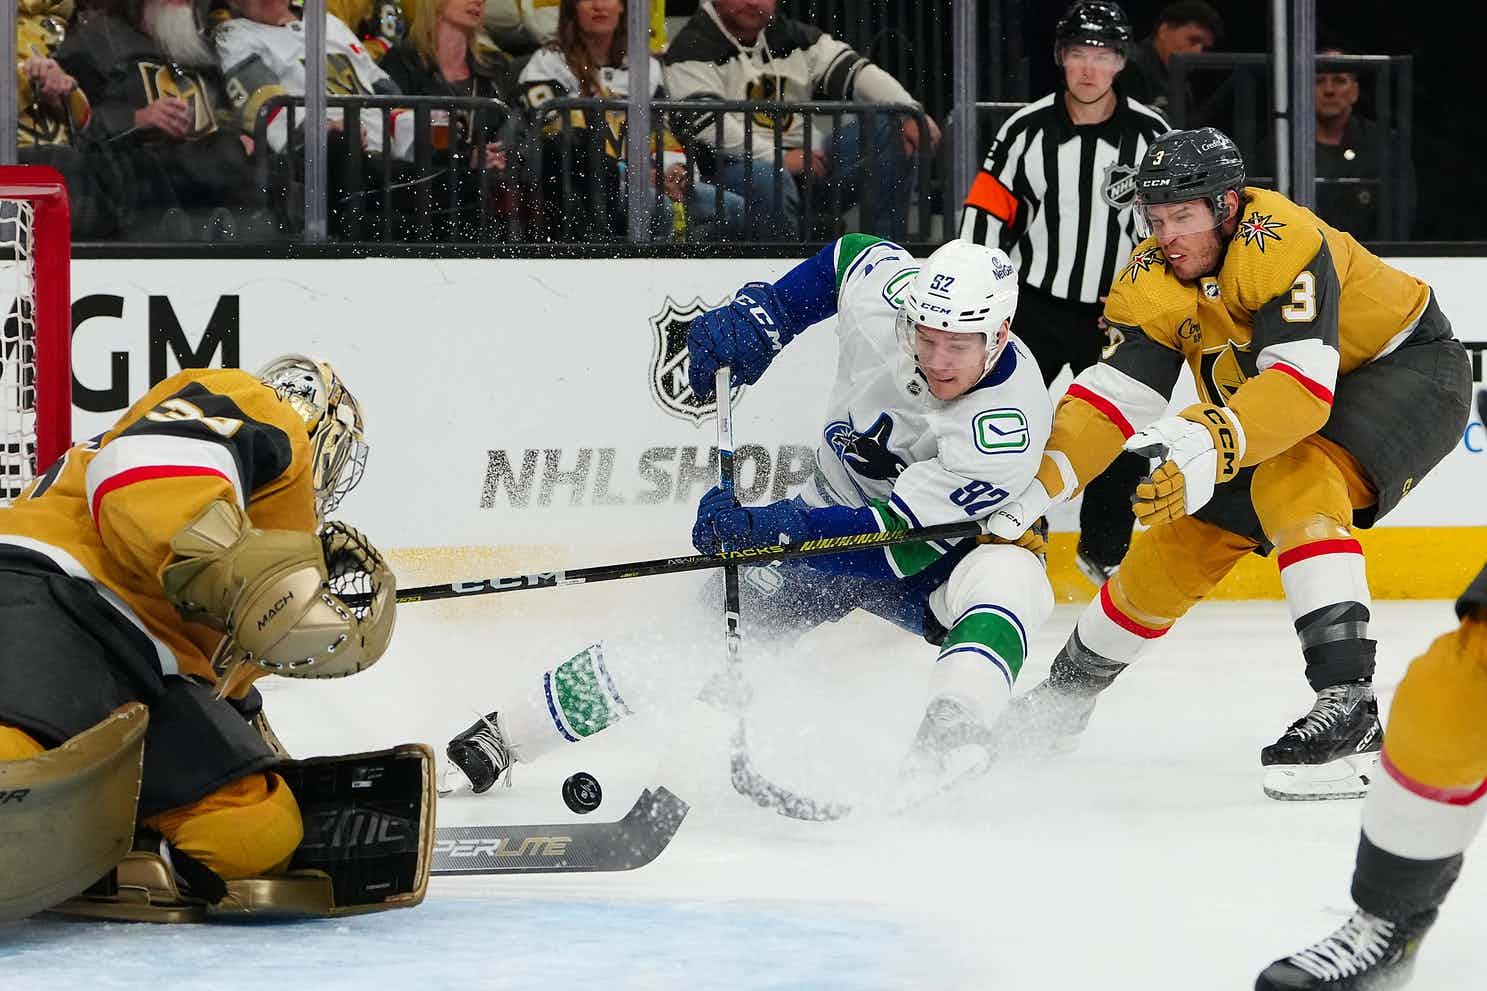
Keith Ballard, shown here putting his body on the line for the team, is easily the Canucks best shot blocker.
But would you describe him as the team’s best defensive player?
The objective, numbers centric approach we pride ourselves on at Canucks Army isn’t intuitive and admittedly some of the concepts can be challenging. As such, I figured it might be informative if I explained in depth why I’ve taken umbrage at the way several analysts have misused the numbers over the past week.
Read past the jump for more!
During the Vancouver/Columbus game, Province Sports beat-writer Ben Kuzma had this to say about the Canucks’ performance:
Jackets showing some jam. Have blocked 27 shots through two periods. Canucks have blocked just seven.— Ben Kuzma (@benkuzma) March 18, 2012
Obviously, showing “jam” contributes to winning hockey games. If one team is so far ahead of the other in “jam,” the numbers on the scoreboard barely matter!
Mostly, “heart” “grit” “jam” “toughness” or whatnot are buzzwords used by people as intangible qualities to prop up their arguments or observations. The new “real time” statistics tracked by NHL.com in recent years have allowed people to make these intangibles more tangible, but too often these “real-time statistics” just aren’t used in the proper context.
I once saw a Chicago fan last season explaining that Detroit isn’t a good defensive team by pointing to the club’s low shot-block totals. Fact is that Detroit has low shot-block totals for two reasons:
- Their in-arena scorer is very stingy in awarding both missed shots and blocked shots, and
- They always have the puck in the other team’s zone, which means they there aren’t a lot of opportunities for Detroit to block shots in the first place.
Now I don’t mind it when people use statistics to back up their argument, that’s what I do for a living! But I take issue with the fact that a lot of people (this goes for general fans as well as mainstream analysts) use weak statistics to back up their argument when there are better alternatives at stake.
This doesn’t mean that shot blocks don’t mean anything. Oh no, they mean lots. In fact, I calculated a pretty strong correlation over the last three seasons between the number of shot blocks and the number of points per game a team gets. The problem is that the teams that block the most shots are the ones who have the fewest wins:

Now that’s not necessarily a huge correlation, but the r-squared is .144 (0 implies no correlation, 1 implies perfect correlation) and you’ll notice the trendline is negative. Of course, this doesn’t necessarily imply that blocking shots causes losses (and blocking a shot is certainly preferable to the alternative of letting the shot through) but it does indicate that a huge deficit in total shot block numbers isn’t necessarily a positive.
There’s a reason why we use the numbers we do at Canucks Army. We pick things that are both repeatable, predictive, and correlate with winning. Scoring chances, Fenwick, Corsi, these things are all advanced stats, advanced implying they’re better than what you can get in the NHL.com events summary (although we link to it every night because there are always good nuggets in there. The event summary splits up even strength and powerplay shots, it shows you the number of shot attempts per team and player, and also includes faceoff data – all essential information).
One of the first things Bill James attempted to do in his 1977 Baseball Abstract was re-think how people judged defensive play. Going back to my earlier point about the Chicago fan, good defence shouldn’t be qualified by the number of blocked shots a team has, but rather how many goals it gives up. In the end, that’s what counts. Good offence can’t be qualified by speed, forechecking, skill, vision or any of those intangible qualities, but whether or not the puck goes in the net more than a replacement.
After the Vancouver/Minnesota game, ex-Canuck turned analyst Garry Valk had this bit of analysis:
Vancouvers bottom 6 forwards had a grand total of 5 hits tonight. WATCH YOUR HEARTS!!!!— Garry Valk (@gvalksportsnet) March 20, 2012
Obviously, I never played at a high level. But neither did a lot of good General Managers, who became lawyers or agents at the end of their playing careers after taking some form of higher education. While Valk did play at a higher level, I’m not sure that earns him a free pass to use hits (as if they indicate anything worthwhile) in his analysis. Maybe in his day, coaches paid attention to whom was hitting whom, but I’d trust the Canucks brass to stay away from something so inefficient as “who had the most hits?”
I replied with this, and the proceeding image will show you why:
@gvalksportsnet Any evidence that teams that hit the most win the most games, Garry?— Cam Charron (@camcharron) March 20, 2012

Hits to points percentage over the last three seasons has had an r-squared value of .0002, so it really doesn’t matter. Part of the problem is the way that the NHL records hits is messed up, because different arenas have different criteria. You could judge “hits for/hits against” as a rate stat if you really wanted, but I don’t think you’d get really far if you did. JP Nikota has looked at “zone hit ratio” as determining where the hits took place (ie, hits the defensive zone aren’t as good as hits in the offensive zone) but he couldn’t really find a reason to think it synced up with puck possession.
Certainly, that doesn’t mean “don’t hit,” but it means that hits may not be the best way to look at whether or not the Canucks’ bottom six (who were awful by our scoring chance data) were effective or not. It’s also not really an accurate measurement of whether or not a team is “hard to play against,” and it’s worth noting that last years Boston Bruins, undoubtedly the NHL’s version of the Baltimore Ravens, were 22nd in the league in hits last season. Physical play matters, but it doesn’t necessarily show up in the “hits” statistic.
I’m sure you could find several games where the Canucks bottom six out-hit the opposition by a good margin and got crunched in possession. More importantly, hits just aren’t the objective stat that Valk seems to think they are: they’re entirely subjective, and based on the bias of each arena scorekeeper. It’s much like the “error” in baseball that Bill James attempted to remove.
We like to use scoring chances as the best mix between “puck possession” and “shot quality” statistics. When we don’t have available scoring chance data, we use Fenwick, because it is an underlying number that correlates highly with scoring chance data: players that have a high Fenwick—a shot differential statistic that includes missed shots—number will also have a high scoring chance +/-. We know this is true. And we know that Fenwick is important:

Like Vic Ferrari wrote in the above link, “If you can’t spot the pattern there, well you’re just not trying”.
There is a reason that Canucks Army uses the numbers we do, and it’s not because we’re trying to thumb our nose at mainstream media folks (though we do that sometimes too). It’s because these are the superior numbers – they’re shown to be predictive of future wins and losses and we’re just doing our best to give our audience the most useful information available.
Recent articles from Cam Charron