Travis Green’s Defence of Michael Del Zotto is Littered With Flawed and Troublesome Numbers

By Jeremy Davis
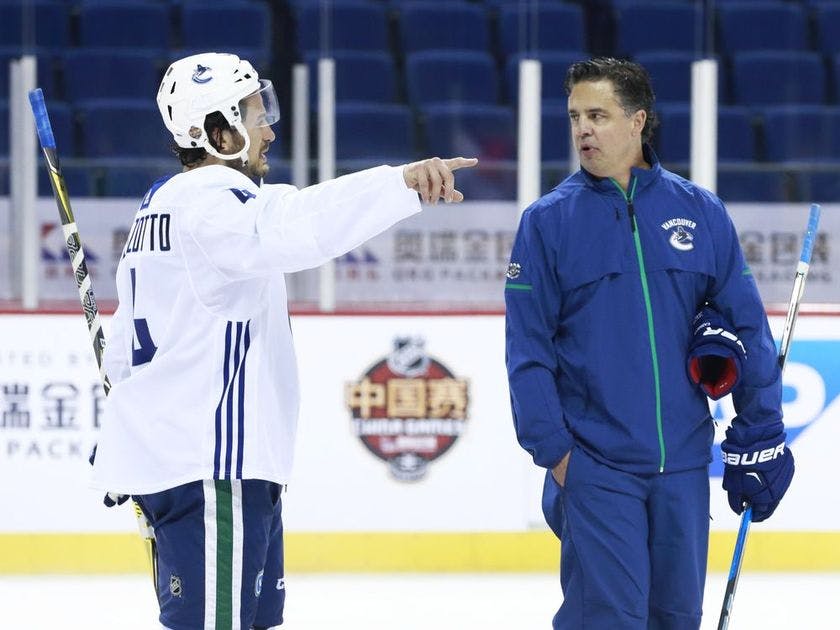
6 years agoIt’s been a trying season for Canucks defenceman Michael Del Zotto. The off-season free agent signing has been relied upon heavily by rookie head coach Travis Green, and the numbers haven’t been particularly flattering.
Although, I guess that depends on who you ask.
If you ask me (or, likely, many of my peers, be it here or elsewhere), you’ll hear a tale of a defencemen that gets buried in shots, scoring chances, and of course goals. One that appears to be ill suited to playing heavy minutes against top opponents, and yet has to do it anyway, with disastrous results.
Del Zotto’s 44.4% Corsi-for percentage is better only than Gudbranson’s 43.7%. He also has the second worst Fenwick-for percentage, shots-for percentage, goals-for percentage, and fourth worst expected goals-for percentage.
| Player | GP | TOI | CF% | FF% | SF% | GF% | xGF% |
| ERIK.GUDBRANSON | 31 | 470.8 | 43.7 | 43.0 | 41.8 | 43.2 | 43.3 |
| MICHAEL.DEL ZOTTO | 48 | 803.6 | 44.4 | 44.5 | 44.7 | 39.0 | 45.5 |
| ALEX.EDLER | 37 | 628.0 | 46.4 | 47.2 | 48.5 | 41.6 | 43.9 |
| BEN.HUTTON | 43 | 680.0 | 47.6 | 46.4 | 47.3 | 47.6 | 46.0 |
| CHRIS.TANEV | 32 | 500.6 | 48.2 | 47.3 | 48.2 | 53.7 | 47.7 |
| DERRICK.POULIOT | 40 | 621.8 | 48.2 | 49.5 | 48.8 | 37.9 | 48.9 |
| ALEX.BIEGA | 24 | 338.2 | 48.7 | 49.2 | 51.2 | 47.1 | 51.6 |
| TROY.STECHER | 35 | 546.5 | 49.2 | 48.1 | 47.9 | 40.5 | 44.4 |
Most of this is driven by how much he allows. Among Canucks defencmen, Del Zotto has the worst rates of Corsi, Fenwick, shots, and goals against. All of this is to say that the numbers are pretty bad.
If you ask Travis Green, however, he can give you a list of metrics that purportedly support Del Zotto and the contributions he has made to the team. Let’s just say that they aren’t exactly the type of numbers you’d find us at Canucks Army using to support players (and there’s a reason for that, which I’ll get to).
A lot of people base numbers on plus-minus. He’s got some points for us, he’s got 14 points. I know he’s minus-19. There was a stretch of games where he probably had four or five pucks that went off him. He was probably on the ice for a few empty net goals. You take that away and all the sudden that’s six different and he’s a minus-13.He also has 123 hits for our team, on a team that isn’t really physical. We don’t have a whole lot of physical guys. He leads our team in hits, he’s right up there in blocked shots. And those are things that a lot of people miss and they don’t talk about a lot with Michael Del Zotto. It’s a good example of how hard he works on the ice, how hard he competes, he makes some mistakes but he also plays against top guys in the league. I look at our d-core – we’ve got a group where I like all of them. It’s not an easy decision. Michael Del Zotto’s been in the league for a long time. We have some other young D that we need to push to get the most out of [them]. I think that Del Zotto is a player that, can he tighten his game up, can he become a better player? At his age, he’s almost where he’s at.We need to make sure that the young d-men that we have, the young forwards that we have, we develop them, we make sure that they’re accountable and a lot of times playing or not playing is based on age, and sometimes it doesn’t matter and you see a veteran guy sit out. But you have to give those guys the benefit some nights, and sometimes you don’t, and we haven’t gotten to that stage yet. I love Del Zotto’s compete.
(h/t to Jason Botchford and the Provies, which is where I first noticed the quotes.)
First of all, I’ll touch briefly on the mention of plus-minus here. If you’ve managed to find your way to this website, you probably already know that plus-minus is a very, very bad statistic. In fact, Travis Green did a fine job here of listing some reasons why plus-minus is so bad.
For one, plus-minus includes multiple types of situations. So you think it’s silly that Del Zotto is punished statistically for empty net goals? That’s why we prefer to use 5-on-5 time. Secondly, luck plays an excessively large role. On-ice goals are a volatile statistic even over large samples (for reasons that I touched on here), and assigning meaning to them at small samples, even half a season, can be foolish.
So it’s a good thing that he’s casting aside Del Zotto’s plus-minus here. However, the reference in and of itself is troublesome.
Green’s reference to plus-minus is what we call a concession, in combination with attitude inoculation. He readily admits a flaw in the player he is about to defend, anticipating a counterargument before it presents itself, and then attempts to quash it. The idea is to make it clear to others that you have considered the opposing viewpoint, in a effort to strengthen the appearance of soundness of your own argument. It’s a smart tactic, but the fact that plus-minus is the counterargument that he anticipates is odd, and suggests that he doesn’t exactly know what the actual criticisms of the player are.
You’ve probably heard the saying that statistics can be manipulated to support any argument, and that is most certainly true. Travis Green has just shown that there are numbers in Del Zotto’s favour, in addition to the numbers I laid out above that are not nearly as complimentary.
Here’s the thing about that saying though: not all support has equal weight, and even if there are numbers that support both sides, that doesn’t mean that both sides are equally right. The saying is frequently used by stats doubters as a method to weaken a statistical argument, but it requires a certain naivety to be duped by faulty stats, and so the only reason to fear that a statistical argument might be selling you a false conclusion is if don’t have the ability to assess the methodology.
So, if this is something that you struggle with, I’ll be happy to do it for you.
Let’s take a look at some of the stats involved in this issue, and what they really tell us.
Blocked Shots
You may have heard this wonderful adage before: blocking shots is akin to killing rats; it’s preferable to do it, but if you’re doing it all the time, you probably have bigger problems. Originally credited to Kent Wilson (a Nation Network employee covering the Calgary Flames), this very succinct comparison undercuts even the most devout of Kris Russel supporters. While blocked shots are better than ones that make their way to the goalie, the bigger problem being referred to therein is that if you’re blocking a lot of shots, it means that you don’t have the puck very much.
This is far from ground breaking information. Public research on this goes back at least as far as 2009, when Richard Pollock found that blocked shots (at a team level) had a negative correlation with standings points (i.e. the more shots a team blocked in a season, the fewer standings points they had).
Since then, there is a wealth of further research on the subject. In 2012, Cam Charron (now an employee of the Toronto Maple Leafs) looked at the difference between raw blocked shots and the marginally more useful blocked shot percentage; HockeyGoalieEh delved deeper into correlations between blocked shots and shot shares over at Match Sticks and Gasoline; Ari Yanover of FlamesNation has published a couple of articles on the perceived value of shot blocking that included which events were most likely to occur immediately after a shot is blocked versus after a save is made.
Every article that digs into blocked shots finds some variation on the same conclusion: doing it too often means that you aren’t spending that time generating offence, and thus are more than likely being outplayed.
Hits
Hits is another interesting statistic from an “old school” versus “new school” perspective. Like blocked shots, it’s one of the few statistics that it presented during broadcasts of NHL games (at least on Sportsnet), and, like blocked shots, it is often linked to toughness.
Also like blocked shots, it’s been criticized as a statistic that inflates for teams (or players) that don’t have the puck. Richard Pollock ran the numbers here too, back in 2010, and found that there is essentially no correlation between hits and standings points, which means (sorry Garry Valk) you can’t routinely out-hit your way to wins.
If you get into the nitty gritty of it, as Garret Hohl did over at Hockey Graphs, you’ll see that on a player-by-player basis, those that spend more time hitting also spend more time getting scored on.
(Source: Hockey-Graphs)
The hits statistic has another problem though: is a fundamentally flawed as a result of the subjectivity of what counts as a hit. With blocked shots, we all know the formula: shot leaves stick + shot hits opposing player = blocked shot. With hits, though, it’s difficult to tease apart what counts as a hit and what doesn’t. Hockey is a physical game, and bodies are constantly rubbing up against one another (as Judd Brackett would say). Not everyone’s idea of where the threshold for a hit is the same, and as a result, hits vary wildly depending on which building they occur in.
Furthermore, merely being credited with a hit gives you zero insight into the usefulness of the action. Some hits remove the puck from an opponent, while others occur after a successful pass has already been made. Some hits knock players on their asses, while others are token rub outs that barely impede a player’s movement.
The effect of a hit can range from a forced turnover, to accomplishing nothing more than putting oneself out of position. Merely adding to a hit total doesn’t tell us anything about what the effect actually is.
And that’s not even touching on the fact that highly physical players tend to have shorter careers. In 2015, just prior to getting hired by the Florida Panthers, former Canucks Army staffer Cam Lawrence found that players with high hit rates (>2.6 hits per game) play significantly fewer games from age-27 onward compared to players with lower hit rates. Obviously each team needs some physicality, but this is worth keeping in mind with players like the 27-year old Del Zotto.
In any case, hits are becoming less and less important in the modern NHL, as the good teams begin to deviate from “heavy hockey” in favour of speed and skill. The type of player that needs to be defended using his hit totals is probably the type of player that doesn’t have much to offer in areas that actually move the needle.
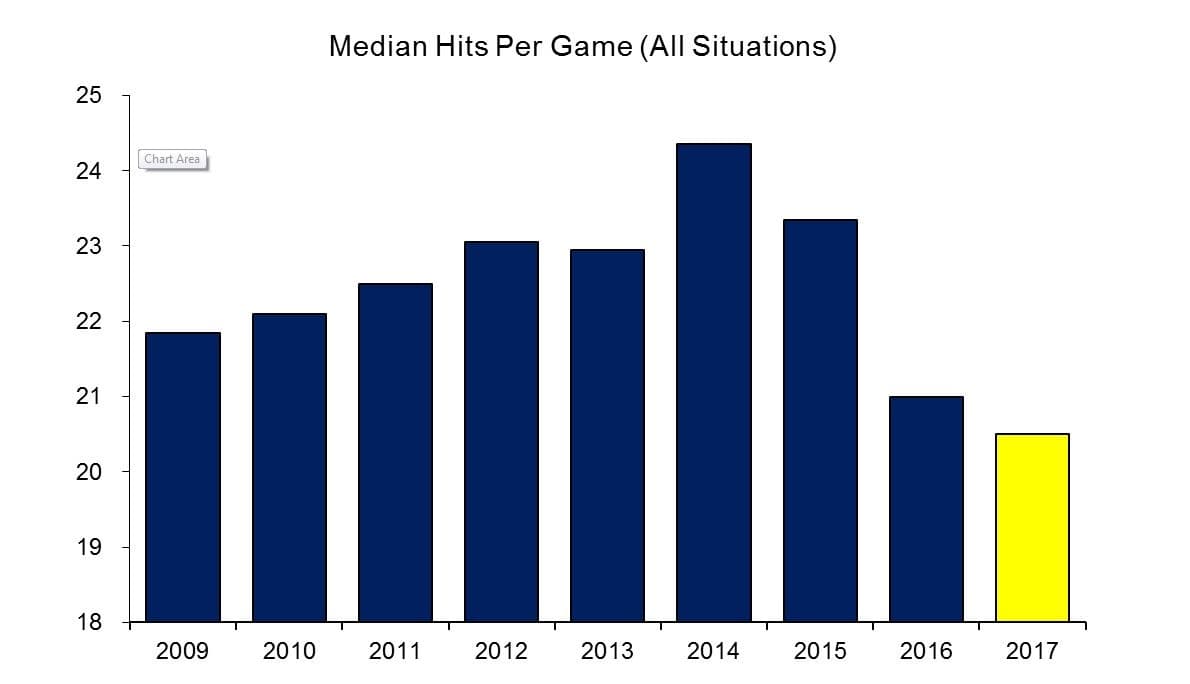
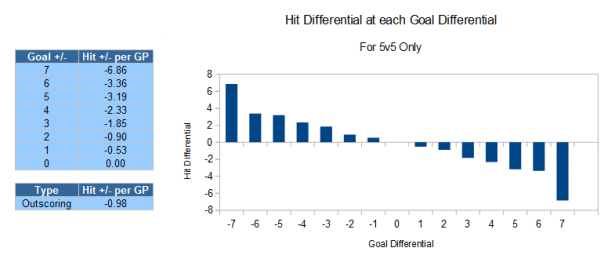
(Source: TSN)
Quality of Competition
A frequent excuse for players that are struggling in big minutes is that they are playing against the opposition’s top players, and that’s why they continuously get outshot or outplayed. This is another one of those examples where the data doesn’t back up what seems like common sense, as in reality, quality of competition is a lot more complicated that many think.
The main reason for this is the same as the one that stats-doubters give when they suggest that analytics can’t explain hockey: that it’s a fast and fluid game. Players are constantly coming on and off the ice, and even though coach’s are responsible for deciding who goes over the board and when, their ability to match up against opponents is often greatly exaggerated. This is especially true when on the road, where the home team has last change and matchups become increasingly difficult. (Of course, in Del Zotto’s case, it’s possible that opposing coaches would want to get their best players out against him because he struggles to contain them.)
Because there is so much change on the ice all the time, players actually spend a lot of time against all tiers of opposing players, especially over a great length of time. Quality of teammates is much easier to influence, as the coach almost always decides who plays with who (players getting trapped on the ice is really the only time the coach doesn’t control this), but quality of competition is much harder to control, and thus the variability of quality of competition tends to be much smaller.
Additionally, the point is often made that defencemen that are truly good at handling top six forwards actually have positive shot differentials. If they’re being buried in shots each game, chances are it’s against all opponents, not just the best ones. Consider Chris Tanev’s generally positive on-ice numbers (this year aside), despite the fact that he very clearly plays more against top opponents than anyone else in the lineup.
The following graphs plots score adjusted Corsi percentage against Quality of Competition (determined by the opponents’ average percentage of 5-on-5 time on ice). In it, you’ll notice that there is actually a slight positive correlation between shot shares and quality of competition. This is because coaches are generally good at pitting their best defencemen against top competition. You’ll also notice that not only does Michael Del Zotto have the worst shot share on any defencemen that made the cut, but his quality of competition is actually in the middle of the pack.
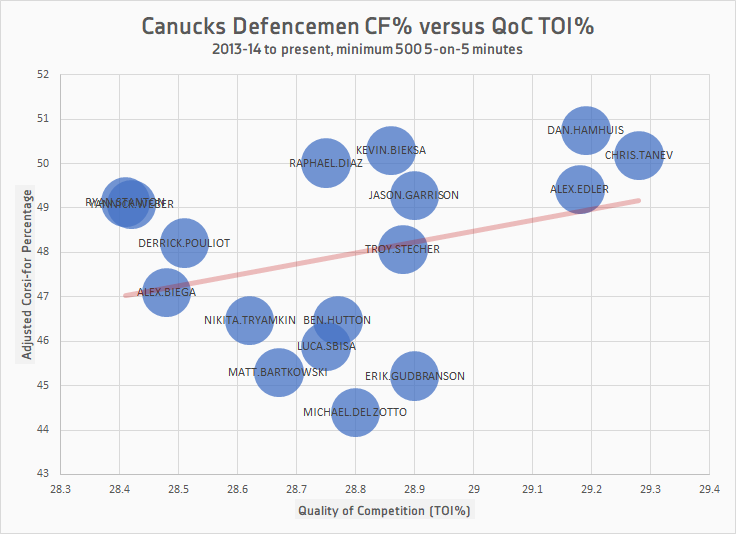
Chris Tanev and Alex Edler regularly take the brunt of the tough matchups, and although Del Zotto occasionally plays with Tanev, his quality of competition on average is much lower because he also plays on other pairings that get much easier matchups. You can see in the graph immediately above that Del Zotto’s QoC is markedly lower than the likes of Edler, Tanev, and Dan Hamhuis, and lower even than Gudbranson, Jason Garrison, Troy Stecher and Kevin Bieksa. He’s not getting buried while playing mostly against top forwards, he’s getting buried by everyone.
While we’re on the topic of shot attempts, let’s move on to some numbers that actually have some serious support behind them.
Shots (or Shot Attempts)
I don’t know if there’s anyone reading this that doesn’t understand why shot shares (Corsi, Fenwick, etc) are important, but I’ll run through it quickly anyway.
Obviously, goals are important in the game of hockey. They are the only thing that really matters when it comes to actually winning games. The value of everything else involved in hockey (from shots and zone entries to toughness and leadership) should be measured only by its ability to predict and influence increases in goals for and decreases in goals against.
The thing is, some of these things are difficult to measure, either logistically or theoretically. Zone entries (as with as things like zone exits, shot assists, and entry break-ups) have to be hand tracked, which naturally reduces the overall amount of data available, and increases the difficulty in accessing it. Abstract ideas like toughness, grit, compete, and leadership may well be very important, but the level of importance is nearly impossible to nail down because they are subjective qualities that can’t be measured objectively. We simply don’t have the ability to assess the correlation between leadership and goal differential, and while that may not be important to some people, it’s significant in terms of legitimately knowing where intangibles stand compared to tangible statistics in terms of influencing wins.
Shots on the other hand are widely available, and have been for quite sometime, leading to a large amount of research on the subject in terms of repeatability and predictivity. Consider this table from CJ Turturo at All About the Jersey that lays the correlations (R) and goodness of fit (R^2) of various tiers of shots and goals.
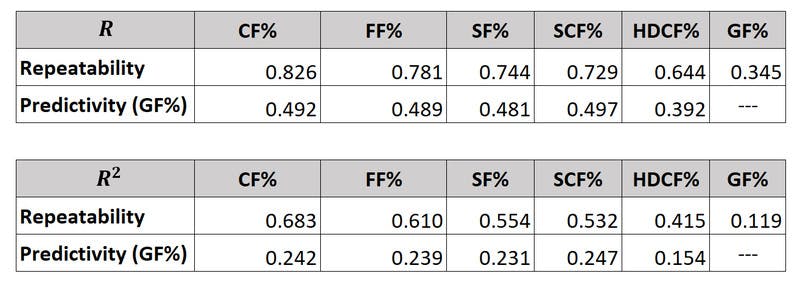
As you can see, Corsi is the dominant shot type in terms of predicting future goals, and both the repeatability and predictivity of goals decreases as you can down in tier, eventually leading to goals, which, comparatively, do a very poor job of predicting future goals. Part of the reason for this is reducing the sample and eliminating useful, something that I wrote about in my piece on analytics as hockey’s representation of the scientific method.
Shots in hockey are tiered based on their level of success. Some are blocked before coming close to the net; some miss the net; some are stopped by the goalie. It’s only a select few that land in the back of the net. It’s also only these that are required for a victory.Only one in every 20 or so attempted shots becomes a goal, on average, and it’s difficult to pinpoint which shots those are going to be, even with what we’ve nailed down regarding shot quality. But the fact that in some games there are goals three goals for every 20 shot attempts and in others there are none doesn’t change the fact that the average will force the shooting percentage to balance out over the long term. This is how regression to the mean works.It’s also why shots are a more reliable indicator of future success than goals are. By and large, we know that eventually a specific percentage of them are likely to go in the net, so their value can still be objectified, and there are roughly 20 times as many of them. So we can feel comfortable making some light conclusions based on shots after 20 or 30 games, while goals (or wins, for that matter) can be misleading even on a season scale.
Another part of it is that the idea behind using shot shares to measure player success is that it is supposed to be a proxy for puck possession, which most agree is fundamentally important to winning in hockey. While scoring chances are technically a closer tier to goals than shot attempts are, shot attempts are a closer approximation of pure possession, and from than angle, they are actually more important.
This can be a bit counterintuitive, because some shots are clearly more likely to go in than others. If we want to get even more accurate, we’d want to weight all shot attempts so that dangerous scoring chances are given more weight, but a high volume of longer distance shots, or shots that hit the post (which are counted as misses rather than shots on net) aren’t entirely ignored.
That’s the whole purpose of Expected Goals. There are a variety of methods of creating this metric, though they are all similar theoretically, and they are all highly efficient at predicting future offence. Take Dawson Sprigings’ version for example, which has been shown to be more effective at predicting goals-for percentage at the team level than even Corsi-for percentage, the previous goal standard.
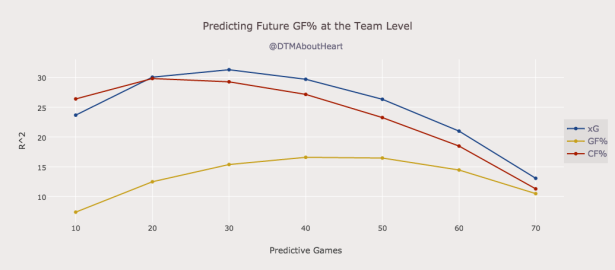
(Source: Hockey-Graphs)
Production
There’s one thing that I haven’t covered in detail here, and that’s Del Zotto’s production. Green also mentioned Del Zotto’s 14 points (two goals, 12 assists), which is second among Canucks defencemen right now.
Three things have helped him this regard: he hasn’t missed any games, he gets a lot of ice time in the games he plays in, and he’s had plenty of power play time, especially early on. He leads the team’s blueliners in 5-on-4 points per hour, though four of his five 5-on-4 points are secondary assists. His primary points per hour on the power play is actually last among Vancouver defencemen who see regular power play time. In terms of 5-on-5 production, he sits fifth, behind Edler, Tanev, Derrick Pouliot and Alex Biega.
Del Zotto has a slightly above above on-ice shooting percentage, which is helping him get some extra points, by all in all, this is a good thing. I don’t want to take too much away from a player who is producing, as that really is the end goal.
The problem with Del Zotto is the same problem that we had with Brandon Sutter last year when he was producing at a decent rate. It doesn’t really matter how many points a player is getting if the other team is scoring twice as many goals as his team is whenever he’s on the ice. With a goals-for percentage of 38.8%, Del Zotto is dangerously close to that right now. It’s important to team success that he continues to produce, but it’s even more important that he gets a handle on the goals against.
Closing Thoughts
Michael Del Zotto is a clear cut case of a player who is tallying up some nice old school numbers, but is being buried in the areas that actually matter in terms of outscoring an opponent. The fact that he’s racking up a lot of hits and blocked shots does not come close to absolving him of being among the NHL’s worst defencemen in suppressing shots and scoring chances.
It can be difficult to sift through so many different metrics to determine what sort of effect a player is having on the game, whether he is thriving, surviving, or struggling. The best way to sift through that information is to lean towards metrics that have strong support in terms of predicting goals and wins, and be wary of metrics that don’t. Moreover, stay away from praising a player for numbers that outright indicate that he’s chasing the game.
Travis Green and the Canucks staff would probably be better off if they adhered to these general principles. At best, they could see noticeable improvements on the ice if the put these basic ideas into practice, and at worst they could avoid looking like they’re lacking an understanding of which numbers are helpful and which are not.
Recent articles from Jeremy Davis