An Improvement in Competition Metrics: The Sedins Play The Tough Minutes

11 years ago
Hey lookie here, it’s a Sedin facing the opposition’s top defenseman. Quel surprise!
The application of advanced analytics to hockey has allowed us to better contextualize offensive production. Generally speaking however, I think our understanding and ability to "rate" offensive play lags behind our ability to evaluate defensive play (for now).
There are metrics that do a reasonably good job of measuring offensive contributions, GVT and Vukota for example, and it has been proven that better players drive on-ice shooting percentage. Still, many of the existing metrics we rely on arguably fall short of capturing the full value elite offensive players bring to their respective clubs.
Take for example, zone-start adjusted possession numbers. If you run the adjustment on players with extreme deployment patterns, and extreme deployment is Alain Vigneault’s bread and butter, the usefulness of these metrics falls apart pretty quickly. Using our current, crude adjustment method (which, appropriately may need to be adjusted), Malhotra becomes a positive possession player, despite having the lowest Corsi-Rel in the NHL last season. Meanwhile possession dynamos like the Sedin twins fall into the red possession wise, which is insane.
"Every goal scored is just another Corsi event" is a good distillation, I think, of the shortcomings of the underlying numbers. My point here is that advanced stats can "overrate" the contributions of defensive players – even if defensive play is extremely important – while underrating the impact of the guys who routinely fill the net. Quality of Competition (QoC) and its Corsi Relative cousin (Corsi Rel QoC) are two other examples of metrics that may not quite give elite offensive players their due.
Advanced stats in hockey are still in their infancy, but luckily we have folks like my colleague Eric T. of BroadStreetHockey.com and NHLNumbers.com who are working to improve the most popular metrics. Late last week, Eric introduced a concept over at NHLNumbers designed to measure QoC based on ice-time.
We’ve long known that QoC and TOI exhibit a positive correlation, but Eric’s big innovation is to separate the amount of time that a player spends against opposing forwards, from the amount of time they spend against opposing defenseman. By looking at which players face the most ice-time against top-defenders, we can get a clearer view of which players the opposing team is most concerned about. Here’s how Eric summarized the advantages of using TOIQoC rather than Corsi Rel QoC:
Now instead of just a single competition metric that answers the question "how good were his opponents", we have a two-dimensional competition metric that answers the more complex question "what kind of opponents did he face?"
Eric’s work has convinced me that his TOIQoC metric is superior to the Corsi Rel QoC numbers we’ve traditionally relied on. If we were to use Corsi Rel QoC to judge the difficulty of competition faced by Canucks forwards in 2011-12 for example, we’d conclude that the toughest minutes were handled by Pahlsson, Higgins, Hansen, Kesler and Burrows. According to Corsi Rel QoC, the Sedin twins facied only moderately tough competition last season.
Does that match up with what we see on a nightly basis? I don’t think so. Game in and game out, it’s pretty clear that opposing coaches make every effort to at least have their top defenseman out against the Sedins. Looking at the Vancouver Forward Usage Chart that Eric produced over at NHLNumbers, his metric seems to capture that better than Corsi Rel QoC:
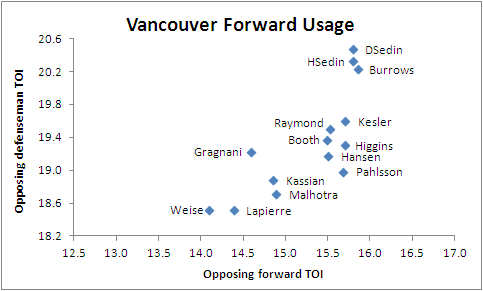
Using TOIQoC, we can see that the Sedin line regularly faces the toughest minutes – especially when it comes to top defenseman. Kesler, Raymond, Higgins and Booth were clearly the most frequent members of the club’s second line last season, and faced top-defenseman for about 19 minutes per game. Hansen, Pahlsson were the defensive specialists, meanwhile the fourth liners (Malhotra, Weise, Lapierre) were the Rodney Dangerfields – they don’t get much respect from opposing coaches…
For the sake of comparison, I called on Rob Pettapiece to draw up a similar "Vancouver Forward Usage Chart" for the 2010-11 season. Here’s what Rob produced:
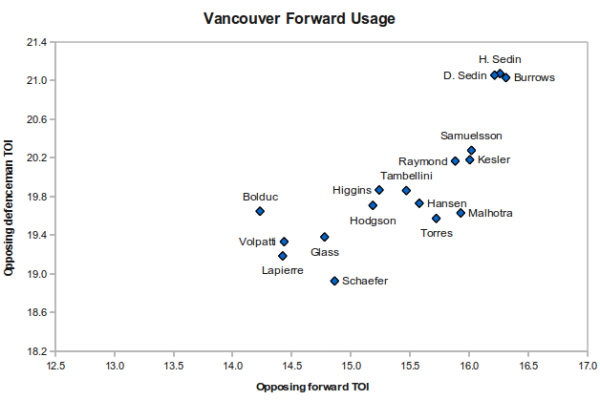
Oddly enough, it looks like the twins faced tougher minutes in 2010-11, than they faced in 2011-12. We can also see that the Canucks had a more established second line in 2010-11 than they did last season (Raymond, Kesler and Samuelsson are closely grouped together). The biggest change between the two graphs however, is that Manny Malhotra faced much tougher competition while playing the "Enabler role" in 2010-11, than he did on the fourth line last season.
I asked Eric to summarize the differences between the two graphs, and here’s what he had to say:
"A number of players changed, but Vancouver’s deployment has remained fairly constant. This year, the top line faced slightly weaker forwards and the third line faced slightly tougher forwards, but those changes were modest.The biggest shift was probably for Malhotra, as dropping to the fourth line meant facing substantially weaker competition, particularly in the opposing forwards. It is a bit surprising that Kesler did not see weaker competition this year than he did during his 41-goal campaign, but you can’t blame opposing teams for matching their top pairings with the Sedins."
Going forward, I’ll still be looking at Corsi Rel QoC. But Eric’s TOIQoC metric certainly does a better job of indicating which forwards opposition coaches are doing the most to game plan against. If we accept – and we should – that coaches are better evaluators of talent than your average blogger, fan or hockey writer; that knowledge is analytically very meaningful.
Recent articles from Thomas Drance