The Mentos Third Pairing and Vigneault’s Early Season Player Usage

11 years ago
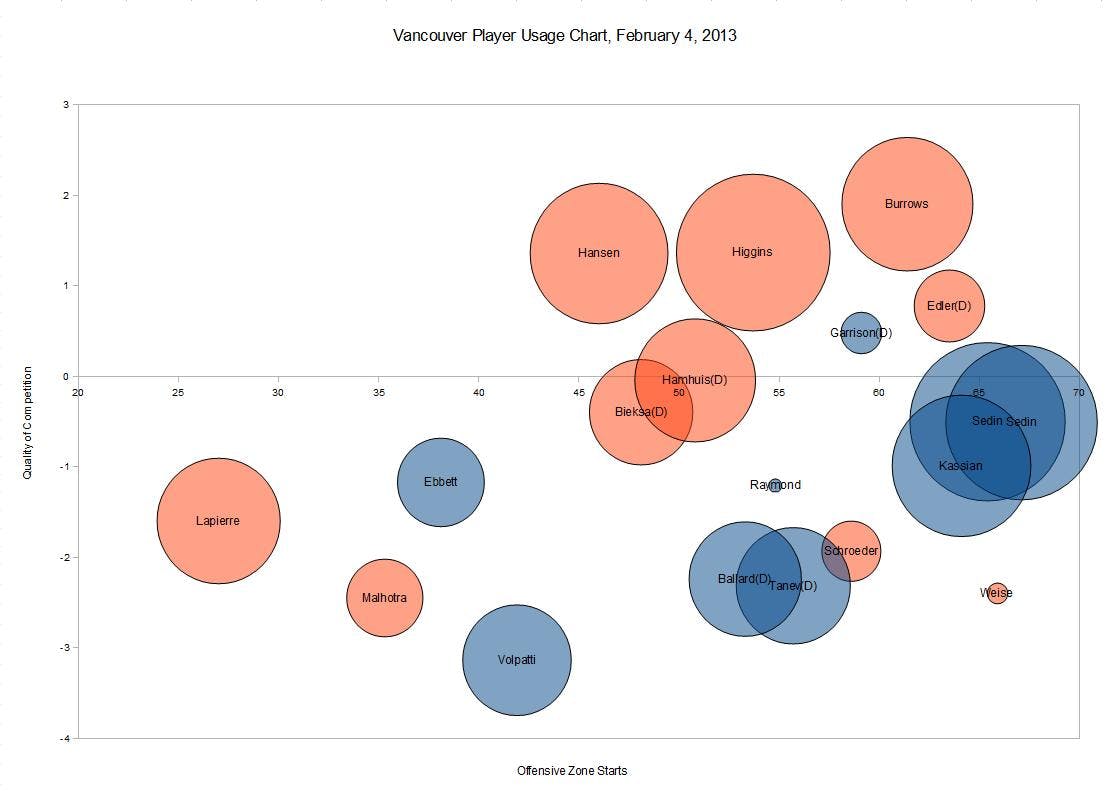
Nerd Credit: Rob Vollman.
It’s early in the season, we still don’t have timeonice.com up and running (and that may not happen all season, sadly), and there’s still an awful lot of small sample noise in the advanced data. This unfortunate correlation of forces makes doing any wide-ranging analysis difficult this early in the season beyond pointing out an unsustainable shooting clip here, or some atrocious bad luck there. One thing that we can already look at, however, are deployment trends and Rob Vollman’s Player Usage Charts (see the image above) are perhaps the most accessible way of doing so.
Read on past the jump.
Let’s begin with a qualifier: the data you’ll find in the above chart still isn’t perfect and there’s still some "small sample" noise in the quality of competition component of the chart (for some teams more than others). But the results are interesting nonethless, and based on a quick cross reference of the chart and Vancouver’s head-to-head ice-time, the quality of competition noise doesn’t show up too much in Vancouver’s team specific Player Usage Chart. That allows us to proceed with a greater degree of confidence, but we should still be wary.
Here’s how Rob Vollman – who drew up this chart – describes the Player Usage Charts he created over at Hockey Abstract:
Player Usage Charts were first introduced in the 2011 off-season as OZQoC Charts after their two primary components: Offensive Zone Starts (OZ) on the horizontal axis and Quality of Competition (QoC) on their vertical axis. OZQoC charts were quickly adopted by dozens of statistical analysts, and even some front offices, most of whom also made various improvements…
Now because of Alain Vigneault’s radical "optimized" deployment schemes, Vancouver’s player usage charts have been exceptionally interesting by league standards over the past couple of seasons. I wrote about their Player Usage Charts from ’10-11 and ’11-12 in a post last Spring, so you can check that out if you want some additional background.
Looking over the differences between Vancouver’s deployment the past two seasons and this season, there are three things that stand out to me in particular.
The Fourth Line:
The first is that, in 2010-11 and even more so in 2011-12, Alain Vigneault did nothing to ease the burden on the fourth line in terms of zone-starts. The likes of Andrew Ebbett, Aaron Volpatti, Dale Weise, Maxim Lapierre and Manny Malhotra were thrown primarily in the defensive end at even-strength, and they often stayed there (albeit against inferior quality of competition). Manny Malhotra’s offensive zone start rate nearly hit single digits last season, which is basically underheard of in the Behind the Net era. This season however, it looks like Vancouver’s fourth liners, are being deployed more evenly between both zones.
A year ago Manny Malhotra, Dale Weise and Maxim Lapierre all hovered just below 20% in terms of an offensive-zone start rate (meaning they started four shifts in the defensive zone for every one offensive zone start). Through eight games this season that rate has nearly doubled in most cases, and in Dale Weise’s case it has tripled to 65%. The only player verging on 25% (which is what Malhotra’s offensive zone start rate was during his Selke caliber "enabler" season in 2010-11) is Maxim Lapierre.
The Third Pairing:
The second thing to notice, involves a seachange in the deployment of Vancouver’s third pairing, and this is where this gets really interesting. Check out Vancouver’s "Player Usage Chart" from a season ago and you’ll find that Vancouver’s primary "third pairing" guys (Aaron Rome, Andrew Alberts and Keith Ballard) are all paired neatly together. Vancouver’s third pairing during the ’11-12 NHL season generally started about forty percent of their shifts in the offensive end, and played against inferior quality of competition. This season so far, the third pairing is starting 55% of their shifts in the offensive zone – a massive shift – and are facing even softer competition.
This is a trend that Cam Charron began to point out last week, actually. The Keith Ballard – Chris Tanev pairing is playing a whole whack of minutes for the Canucks at even-strength, but they’re doing so while playing entirely against the bottom end of opponent’s rosters.
So what matters more to me than the third pairings "offensive zone start percentage" or their particular slot on a player usage chart, is how that deployment impacts Alain Vigneault’s ability to dole out minutes among his blueliners. Follow this intuitive leap with me if you would: by giving the third pairing easier minutes, Alain Vigneault is also able to give them more minutes. Meanwhile the top-four plays tougher minutes, but play significantly fewer of them. Make sense?
Consider that a season ago, Vancouver’s third pairing defenseman (again Aaron Rome, Keith Ballard and Andrew Alberts) were generally entrusted with somewhere between thirteen to fourteen and a half minutes at even-strength per game. Meanwhile the likes of Bieksa and Hamhuis played eighteen or nineteen minutes plus every night at five-on-five. Through eight games this season, however, Kevin Bieksa is playing just a hair over sixteen minutes per game, while the bottom-pairing is playing fifteen and a half minutes at even-strength per game. That seems meaningful, especially when you consider the extent to which this has allowed Alain Vigneault to limit the minutes burden among his blueliners. Kevin Bieksa, for example – Vancouver’s even-strength minutes leader – is playing the 94th most minutes per game at even-strength among all NHL defenseman through eight contests.
I’m not sure what angle that the Canucks are playing at precisely, though I have some theories. Perhaps the Canucks are trying to slowly get their core into game shape and are leaning on Tanev and Ballard in the interim. Or perhaps the Canucks are wary of exposing their blueliners to injury early in a shortened season, and want to do what they can to ensure that the top-four stay healthy. Here’s my actual guess: it’s a bit of both of those things, but mostly the Canucks are trying to keep their top-four fresh while they combat rust, suboptimal fitness levels and fatigue due to increased schedule density. Basically Vancouver’s third pairing may be being used the way advertisers want you to use Mentos: as a freshmaker for the top-four.
Anyway I’d be curious to hear a beatwriter ask Mike Gillis or Alain Vigneault why Vancouver’s top-four defenseman are playing so many fewer minutes this season than last. Seems like a reasonable question, right?
Trap it Up:
The final noticable change is that the Sedin line’s offensive zone start rate is hovering between 65% and 70% so far this season, way down from their 80%+ offensive zone start rate a season ago. I’ll be curious to see if that’s a "small sample" thing, or if Alain Vigneault is legitimately giving plum offensive zone start shifts to other lines, and counting on the Sedins to be slightly better two-way players in Ryan Kesler’s absence. I’d lean towards the latter theory, actually, but we’ll probably never know for sure since Ryan Kesler will return before we get a clearer picture.
I’d also note that the twins are playing fewer minutes overall at even-strength: Henrik Sedin is down thirty seconds per game so far, while Daniel is down a pretty significant ninety seconds per game. Many of those additional minutes appear to be going to the checking line, as Jannik Hansen is playing nearly 45 seconds more per game at five-on-five than he was a season ago. You can go ahead and include your "trap it up" hashtag in the comments.
Recent articles from Thomas Drance