The 1st Hangover of 2013-14
I noted last night that we have changed the format with which we will be analyzing Canucks games this season. We’ll have a rapid recap of the every game as quickly as possible following its conclusion so that you guys have a platform to discuss – whether it’s in the form of ranting, complaining, celebrating a victory, or posing questions – in the comments section.
The morning after we’ll do a more in-depth post which takes a deeper look at the numbers from the game the previous night. It’ll be dubbed ‘The Hangover’. Hopefully over time you’ll come to appreciate it like a refreshingly spicy Caesar following a heavy night of drinking. So without further ado, read on past the jump for the scoring chance totals and some other interesting numbers..
Before we get to the scoring chance totals, allow me to plug ExtraSkater [dot] com, which is pretty much porn for people who enjoy stats. Its interface is so sleek, and it contains pretty much everything you’d want to know. Here’s the lowdown from last night’s game.
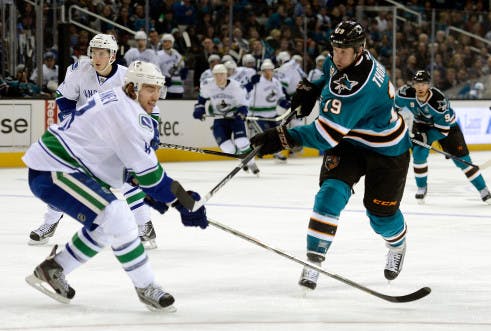
Good god, Chris Tanev was abysmal. He received a lot of credit on the broadcast for his blocked shots on the penalty kill (registering 5 of them, in a painful manner), but the reason he was in position to do so was because the Sharks had the puck pretty much every single time he was out there. The Sharks controlled 38 of the 50 shot attempts with Tanev out on the ice (a Corsi For % of 24.0%). Looking at it further, with Tanev out there the Canucks had 6 shot attempts that weren’t blocked, compared to 28 for the Sharks. Yikes.
As you’ll note below, the worst scoring chance differentials came from Tanev, Santorelli, Richardson, and Hamhuis. Interestingly enough, Hamhuis was the only one of the 4 that didn’t register a horrible shot differential. I thought he had a terrible game for his standards, as he was far too frequently having to take chances we’re not normally used to seeing from him to try and compensate for being a step behind. The possession numbers don’t suggest it, which I guess speaks to the fact that his mistakes were really glaring and dreadful – i.e. the gaffe that sprung Pavelski on a shorthanded breakaway – but not as frequent as I may have thought.
As I mentioned in last night’s recap, other than Luongo and the team’s penalty kill, the two main positives were the play of the team’s top two lines, who actually played like the team’s top two lines. The Sedins were fantastic off of the rush, and looked just fine on the penalty kill.
Meanwhile, the combination of Higgins-Kesler-Hansen looked fantastic with their pressure early on, but faded as the game went along. Hansen was ultimately moved to the 3rd line, likely in an attempt to give the likes of Santorelli and Richardson a life raft of sorts. Unfortunately, what we’ll mostly remember from that 2nd lines performance on Thursday night will be Chris Higgins missing a glorious opportunity to tie it up halfway through the 3rd period, before coughing it up to Logan Couture en route to the goal that made it 3-1. I still really like that trio going forward, though we’ll see if Tortorella prefers Hansen in a role where he tries to keep the team’s 3rd line from drowning.
And finally, I should point out that despite scoring their only goal on the power play, I thought the team’s play with the extra man was rather poor. In 7.2 minutes of power play time, the Canucks registered just 2 shots on net. The team’s 2nd unit – which primarily featured Bieksa, Hamhuis, Burrows, Higgins and Hansen – was the major culprit; in approximately 3 minutes of time, they directed only 2 pucks on net and had no actual shots on goal. I have no idea why John Tortorella seemed so adamant on using the 2nd unit as much as he did, but that’s probably my biggest issue with him coming out of the game.
Scoring Chance Totals:
| Total | 1st Period | 2nd Period | 3rd Period | Total |
|---|---|---|---|---|
| Canucks (EV) | 2 (1) | 7 (7) | 2 (1) | 11 (9) |
| Sharks (EV) | 8 (5) | 5 (3) | 7 (5) | 20 (13) |
Individual Scoring Chance Contributions:
| Chance Contributions | Taken | Created | Total |
|---|---|---|---|
| Henrik Sedin | 2 | 2 | 4 |
| Ryan Kesler | 3 | 0 | 3 |
| Chris Higgins | 3 | 0 | 3 |
| Alex Burrows | 1 | 2 | 3 |
| Daniel Sedin | 0 | 2 | 2 |
| David Booth | 1 | 0 | 1 |
| Jason Garrison | 1 | 0 | 1 |
| Mike Santorelli | 0 | 1 | 1 |
Individual Scoring Chance Differential:
| Player | EV F – A | PP F – A | SH F – A | Total F – A |
|---|---|---|---|---|
| Henrik Sedin | 3-1 | 2-0 | 0-1 | 5-2 |
| Daniel Sedin | 3-2 | 2-0 | 0-1 | 5-3 |
| Alex Burrows | 4-4 | 0-1 | 0-2 | 4-7 |
| Ryan Kesler | 3-3 | 2-0 | 0-2 | 5-5 |
| Jannik Hansen | 3-5 | 0-1 | 0-0 | 3-6 |
| Chris Higgins | 4-3 | 0-1 | 0-2 | 4-6 |
| David Booth | 3-5 | 0-1 | 0-0 | 3-6 |
| Mike Santorelli | 2-7 | 0-1 | 0-0 | 2-8 |
| Brad Richardson | 1-6 | 0-0 | 0-0 | 1-6 |
| Zac Dalpe | 0-1 | 0-0 | 0-0 | 0-1 |
| Tom Sestito | 0-1 | 0-0 | 0-0 | 0-1 |
| Dale Weise | 0-1 | 0-1 | 0-0 | 0-1 |
| Jason Garrison | 5-5 | 2-0 | 0-0 | 7-5 |
| Alex Edler | 5-5 | 2-0 | 0-2 | 7-7 |
| Dan Hamhuis | 2-3 | 0-2 | 0-4 | 2-9 |
| Kevin Bieksa | 4-1 | 0-2 | 0-3 | 5-5 |
| Chris Tanev | 1-8. | 0-0 | 0-0 | 1-8 |
| Ryan Stanton | 0-3 | 0-0 | 0-1 | 0-4 |
Recent articles from Dimitri Filipovic

