Shootout Math: Applications of QualCLUTCH
By Cam Charron
12 years ago
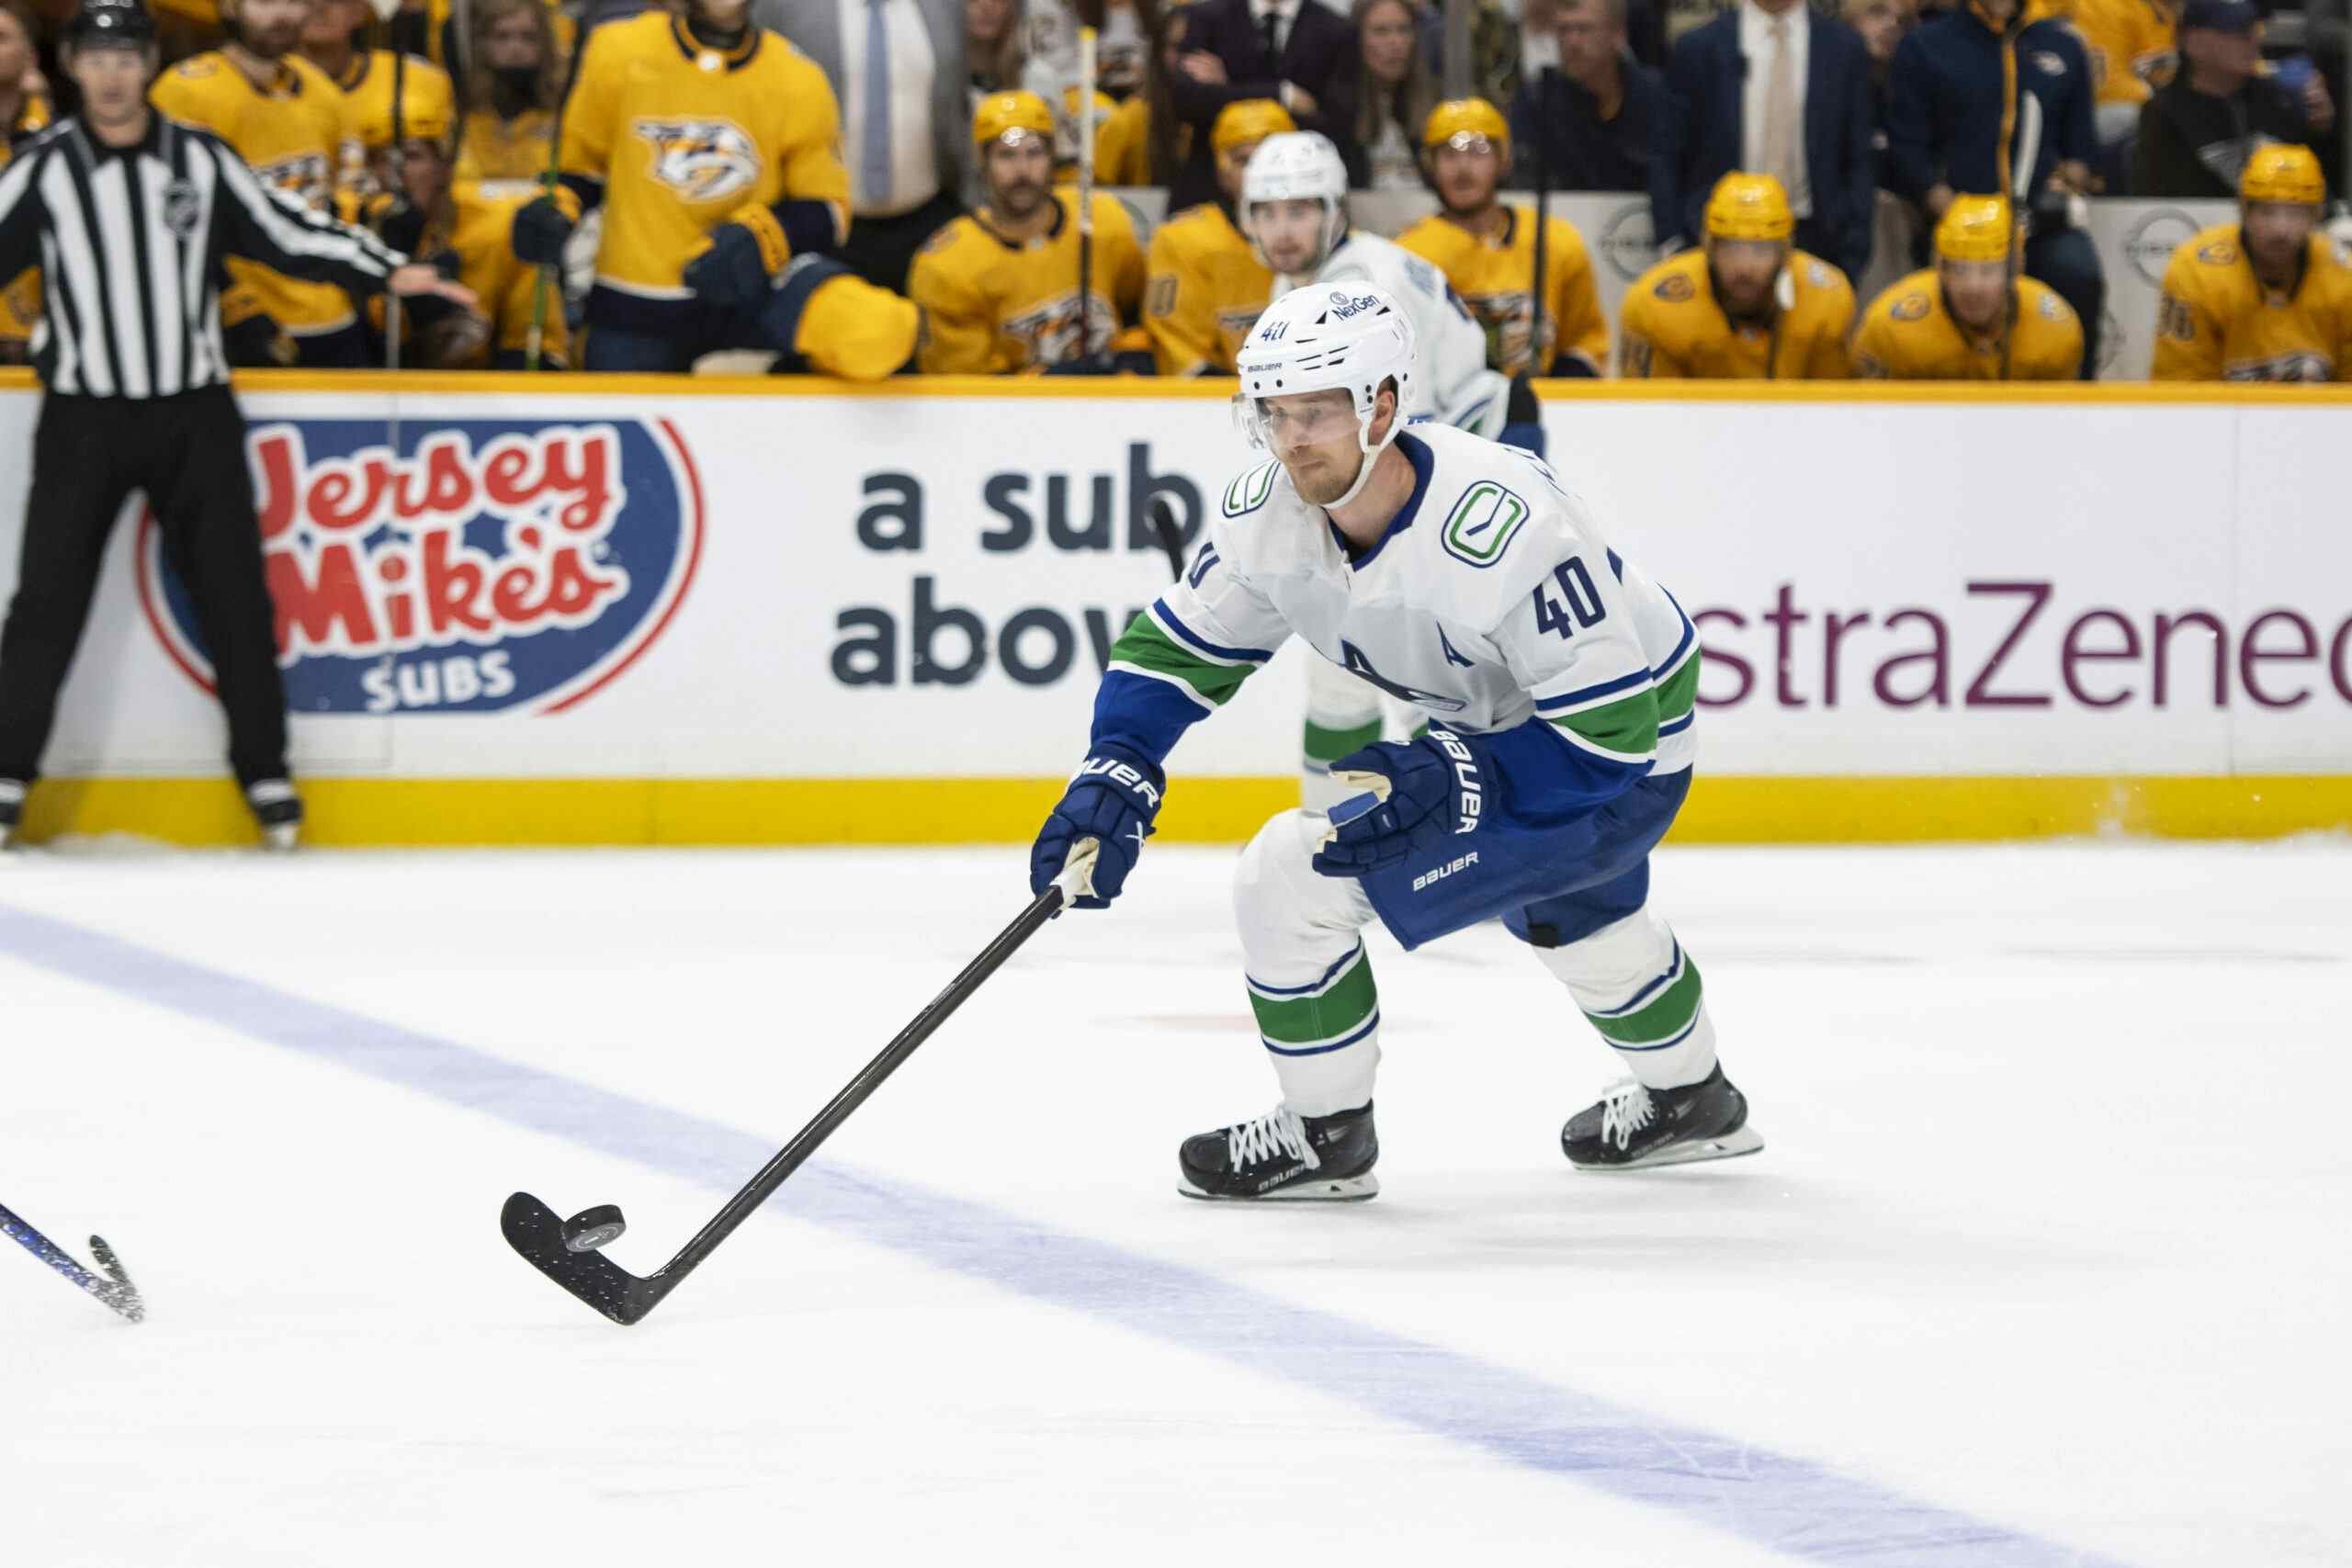
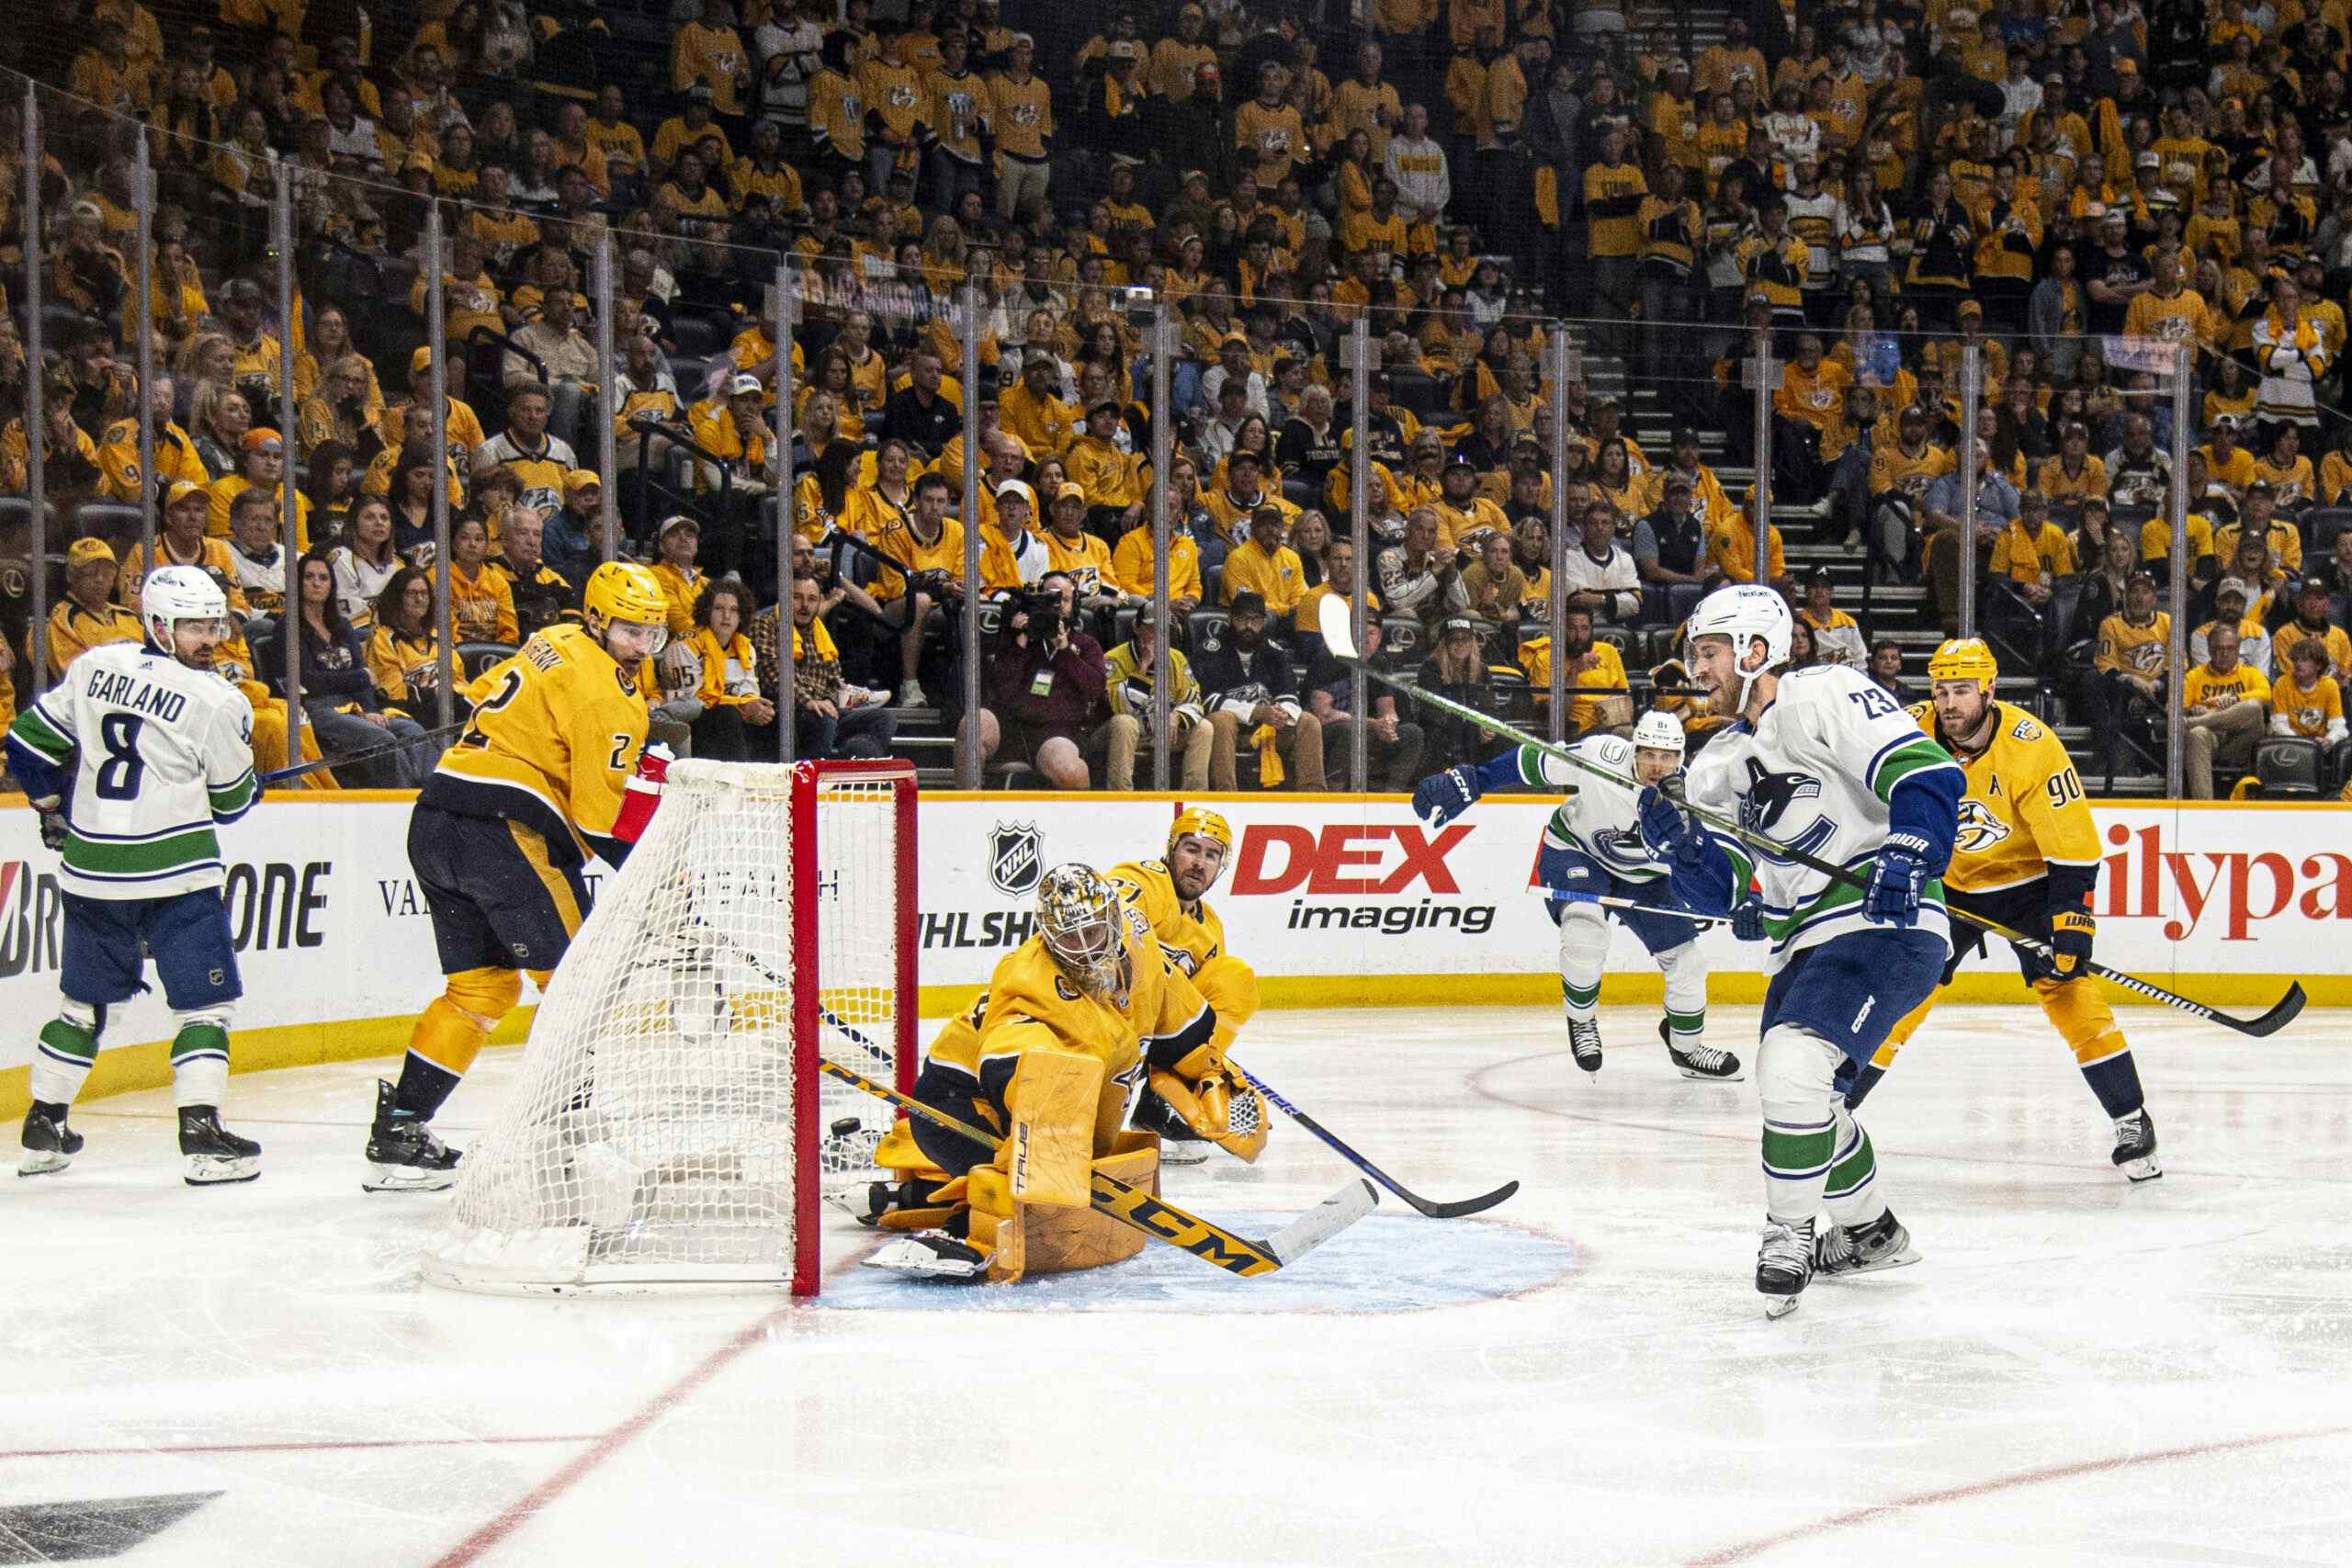
Alex Edler upsets the ladies with his shootout prowess.
You’ve probably noticed but four of the last five games the Vancouver Canucks have played have been settled in a shootout. This isn’t necessarily horrible, at least the home team has been picking up points. They’re also giving us more to fret about over the last week or so than any discussion about obnoxious tie games and how they’re ruining hockey, so there’s that too.
Somehow, out of this mess, the Canucks have emerged as one of the top shootout teams, winning three of their last four and bringing their record up to 5-5 in the skill competition, on the season. So what have we learned from this?
- Roberto Luongo may not be as bad as he seems at this.
- Alexander Edler is actually pretty good.
- It doesn’t really matter one way or the other.
But, again, these things are fun to discuss. For instance, if we know who our best shooters are, when do we send them out? First, second or third? I sent an email off to a mathemagician friend of mine, the pride of Burlington ON Rob Pettapiece, who runs the CIS Blog and, with a math degree from Waterloo, takes a keen interest in the numbers side of sports. I think I was discussing Corsi and Fenwick with him before he even learned the rules of hockey.
So we had a nice email exchange about shootout situations and since Rob has done work in the past that looked at win expectancy for every state of a volleyball game, I was wondering if he could do it for a simpler hockey shooter. This was centred around the basic question “At any given moment in a shootout, how likely are you to win?” Rob went out creating a model that addressed all 15 possible states of a shootout (ie: which team is shooting, what’s the score, and what round).
From that link, there’s a spreadsheet view of each probability. For instance, when the first shooter goes, for example, Mason Raymond on Tuesday in Nashville, his team has a 50% chance of winning. When Raymond missed the net on his first attempt, the Canucks’ chances of winning dipped to 38%. Had they scored, the chances would have increased to 70%. Here’s a nice graph:

You see 13 game states below, with the blue line representing the likelihood of Canuck victory at any moment during the shootout:
- The shootout starts. Both teams have an identical 50% chance of winning.
- Mason Raymond MISS – Canucks chances drop to 38%.
- Sergei Kostitsyn SAVE – Canucks chances are back up to 50%.
- Ryan Kesler SAVE – Down to 36%
- Martin Erat MISS – Back up to 50%
- Alex Burrows GOAL – Canucks chances climb to 82%.
- David Legwand GOAL – Back down to 50%
- Daniel Sedin MISS – 32% (see a pattern?)
- Mike Fisher SAVE – 50% (there it is)
- Cody Hodgson MISS – 32%
- Ryan Ellis SAVE – 50%
- Alexander Edler GOAL – 82%
- Colin Wilson MISS – 100%
After all 13 states have played out, the Canucks’ chances of victory were at 100%, giving them the extra point against Nashville. The reason why the percentage swings more in some states is because of how much “time” is left for the first team to catch up. The Raymond miss in State 2 didn’t affect the team as much as Hodgson’s miss in State 10, because the Canucks still had at least one guaranteed shot ahead.
Two pertinent questions were answered here. One is that it doesn’t matter what order you send your top players out, so long as they are in Rounds 1 or 2 and thus guaranteed a shot. The “leverage index”, which calculates the importance of each shot (Round 3 has more leverage on the outcome than Round 1) is always equal to 1 in Round 1, and averages out to 1 in Round 2. Without knowing what the score will be after the first round, you’re pretty much flipping a coin to determine whether you should send your best shooter out first or second.
The second question is what order the teams play in. Since the leverage indices average out, it really doesn’t matter whether a team goes first or second. Writes Rob:
This isn’t baseball, where batting last gives you an advantage because you know how many runs you need to win. (The baseball analogy would be a home-run derby, with one pitch to one batter from either team until someone wins, which aside from being stupid would not confer any advantage on the first or second team. Of course, if the NHL ran MLB, they’d probably institute that right away.)
Win expectancy graphs are famed in baseball, where they not only tell which team is close to victory and their odds, but also add up how much each player tilted the graph. For instance, a player who brings his team’s chances of winning from 50% to 60% would have a .10 wPA, or “win probability added” which has very little tangible use, but is good for telling a story. Players with high wPA’s are often the “clutch” hitters that win games, or are lucky enough to come up to bat in important situations.
So I decided to do the same thing for the Canucks in shootouts. I looked at all 10 shootouts and added up which Canucks tilted the percentages in their team’s favour. The results were unsurprising:
| Player | wPA | aLI |
| Edler | 40% | 1.19 |
| Schneider | 38% | 1.06 |
| Burrows | 31% | 0.90 |
| Raymond | 5% | 0.95 |
| Luongo | -2% | 1.11 |
| Hodgson | -3% | 1.20 |
| Bieksa | -12% | 1.00 |
| Lapierre | -12% | 1.00 |
| Samuelsson | -12% | 1.00 |
| D. Sedin | -18% | 1.56 |
| Kesler | -55% | 1.17 |
Recent articles from Cam Charron

