My Canucks goal total projections were more noise than signal this season

11 years ago
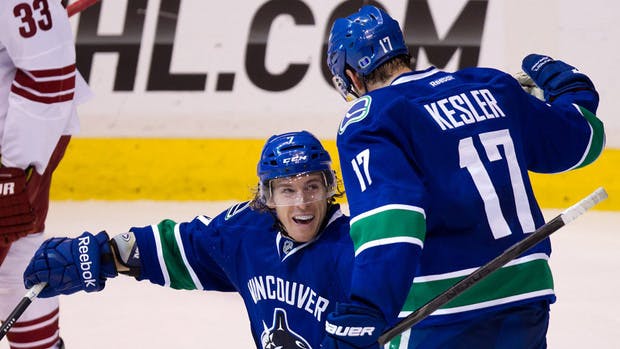
Ryan Kesler and David Booth battled injuries all season. In doing so they made me look bad.
Darryl Dyck/Canadian Press
Before the 2011-12 season I predicted Vancouver Canucks goal totals over at Pass it to Bulis and I did astonishingly well over the 82 game season:
My overall team predictions were much more successful: I had the Canucks scoring 57 power-play goals (they have 55), 178 even-strength goals (they’ve scored 176), 7 short-handed goals (the Canucks have 7) and 5 shootout winners (they’ve scored 8). That my friends, is some serious Rainman schtick.
Yep, I was pretty proud of myself. Well, this season my bubble burst and the model fared significantly less well. I’ll dive into why after the jump.
Before the season I’d forecast 142 goals for the Canucks in total, and they under-performed that projected figure by fifteen goals (or a bit more than 11%). That’s a pretty unequivocal miss. I wrote a whole article boasting about how right I was last year, so I figure I better write one about why and how I missed this season. Seems only fair, right?
With that let’s look into why the Canucks offense didn’t live up to our reasonable expectations over the 48 game season in 2013. Let the self-flagellation begin!
Injuries
Probably the main reason my projections missed this season, were a smattering of injuries that devastated Vancouver’s forward group. Before the season, my model called for Ryan Kesler and David Booth to play 683 and 459 minutes at even-strength and on the power-play respectively. In actual fact, due to their mutual re-injury, they played 290 and 151 minutes at even-strength and on the power-play this past season. Between the two American powerforwards, Booth and Kesler under-performed my model’s projected output by nineteen goals as a result of injury. My model also plugged Manny Malhotra in for four goals, and obviously that didn’t happen…
There’s no way for my model to account for these types of fluke injuries or forced retirements, so I won’t lose any sleep over this part of my model’s inaccuracy.
The Sedin Line
The Sedin twins just completed far and away the best defensive regular season of their careers, and so did Alex Burrows. But they seem to have done so at the expense of some offense, though it’s also quite possible that this is just a coincidence.
Vancouver’s usual top-line combined to score 36 goals this regular season, and in doing so underperformed my model’s expectations by eleven(!). That’s a massive number, and a significant miss made even worse by the fact that all three players were mostly healthy all season (I was basically predicting Vancouver’s top-line to score 23% more goals this season than they actually managed).
Among individual skaters, I pretty much had Henrik’s output right, or close to it, with ten goals (he managed eleven). Daniel however underperformed my expectations by five even-strength goals and two power-play goals, while Burrows managed two fewer even-strength goals than the model called for, and two fewer power-play goals. That Burrows underperformed his expected power-play output despite getting first unit power-play minutes for much of the season (something that my model assumed he wouldn’t get), tells you a lot about how smrt Vancouver’s top-unit formation is at the moment…
Making up the Difference
My model called for the Sedin-line to score eleven more goals than they did, and the model also lost twenty-three goals as a result of injuries to Booth, Kesler and Malhotra. Yet I was only fifteen goals off my projection in total, meaning other Canucks stepped up somewhat and surpassed my expectations to make up the difference.
For example the model called for all of Mason Raymond, Jannik Hansen and Chris Higgins to score eight goals this season, and all three of them managed ten instead. Vancouver’s top-four defenceman all similarly outperformed the model’s expectations. I had Jason Garrison scoring seven goals and instead he managed eight, I had Alex Edler scoring five goals and instead he managed eight, I had Kevin Bieksa scoring four goals and instead he managed six in only thirty-six games, and I had Dan Hamhuis scoring three, a total Hamhuis outperformed by one.
Young Players
Gerry Kahrmann, PNG Files, The Province
The toughest part of the my projections model is accounting for players with limited track record. I used a totally different methodology to calculate expected offensive output for Zack Kassian and Chris Tanev, for example. than I did for the rest of the club. My model was too bearish on both of their totals. It predicted one goal for Chris Tanev, and he managed two, while it predicted five goals for Zack Kassian and he managed seven. Overall I’m pretty happy with that, I tweaked the model after Cody Hodgson completely blasted my expectations for him in 2011/12, and so at least in this one area my model improved over a season ago (even though it still missed).
Game States
My model doesn’t really do detailed projections for shootout winners (which count as "goals for" for some stupid reason) or for short-handed goals. Instead it just relies on the team’s average output over a large sample. Vancouver had two more "shoout winners" than I’d anticipated, which whatever, and only managed one short-handed goal which is pretty unlike them considering their track record under Alain Vigneault. At even-strength (five-on-five, and four-on-four) the Canucks scored 90 goals this season, which is fourteen fewer goals than I’d expected. On the power-play the Canucks scored 26 which is five fewer than anticipated.
Summary
So my model did a lot worse this season, which is disappointing but not altogether that surprising considering the intangible factors that impact a lockout shortened season and the rash of Vancouver Canucks injuries. So, yeah, I don’t think I’ll just toss it in the trash for next season.
For one, the model isn’t really meant to be extremely scientific, it’s just a simple model built to project future production based on a player’s large sample offensive track record and likely deployment. At the very least it’s still a fun excercise.
I also still think it’s a potentially informative excercise, an opinion that’s bolstered by the fact that Robert P. over at Jewels from the Crown built a similar model following my methodology, and his model did much better than mine (he was 7% away from the Kings actual even-strength goal totals, and nailed their power-play totals). The Kings dealt wtih fewer injuries and less uncertainty this past season than the Canucks did, so there you have it.
Recent articles from Thomas Drance