How to Build a Contender – Part 3: Cap Management

By money puck
8 years ago
Photo Credit: Dennis Wierzbicki/USA TODAY Sports
In the first post of this latest ‘How to build a contender’ series, we provided an intro to War-on-ice’s new Goals Above Replacement (GAR) statistic, and in Part 2, we looked at the impact of player aging on player and team performance over time
What we found in Part 1 was that GAR correlates very highly with goal differential and team points, and that the majority of teams that made the conference finals over the past five years scored very highly in terms of GAR. Putting this all together, if you’re trying to build a contender, what you’re really trying to do is put together a collection of players who are capable of achieve a very high team GAR.
Because the goal of any organization should be to build a Stanley Cup winner, in Part 3 of our series, I thought I’d take a closer look into the roster composition of teams who had made it to at least the conference finals in the last five full seasons.
Scarcity of Elite Talent
As previously discussed, successful teams typically have high cumulative team GAR, so I was curious what the breakdown would be of the players by GAR bands, in order to understand just how rare it is to have an individual player who accounts for a high individual GAR number.
In order to investigate this, I looked at all player seasons from 2009-10 to 2014-15 (lockout year excluded, and aggregated all individual player seasons by GAR band (4,323 individual player seasons):

For simplicity I’ve decided to separate player by 5 GAR increments, which is admittedly arbitrary, but seems to be a reasonably match the distribution of the players.
As we can see, there is a very small percentage of the NHLer population who were able to achieve a single season of over 15 GAR (5.9%), and even less who achieved over 20 GAR in a single season (2.4%). This doesn’t tell us anything we don’t already know. There are a small number of stars in the league, whose contribution to their teams is far higher than the average NHLer (64% of NHLers had a GAR between -5 and +5).
Roster Composition
While we can see that generally teams who don’t hit the 107 GAR threshold rarely contend for the cup, I thought it would be interesting to look a the team composition of contenders versus non-contenders (the 26 teams that did not make the conference finals) and the 2015-16 Vancouver Canucks roster (note: I’ve used 2014-15 player GAR totals for Vancouver for simplicity):

Interestingly, virtually every team who has made it to the conference finals in the last 5 years had both a over 20 GAR elite player, and at least one 15-20 GAR star to complement them.
Even many non-contender teams had the benefit of an elite over 20 GAR player and/or a 15-20 GAR star, but as we can see, the Canucks don’t have a player in either of these categories, based on their 2014-15 data. Again, this doesn’t tell us anything we don’t already know.
With the Sedins in the twilight of their careers, it is imperative that management restock the pipeline with players who could conceivably mature into over 15 and over 20 GAR roles.
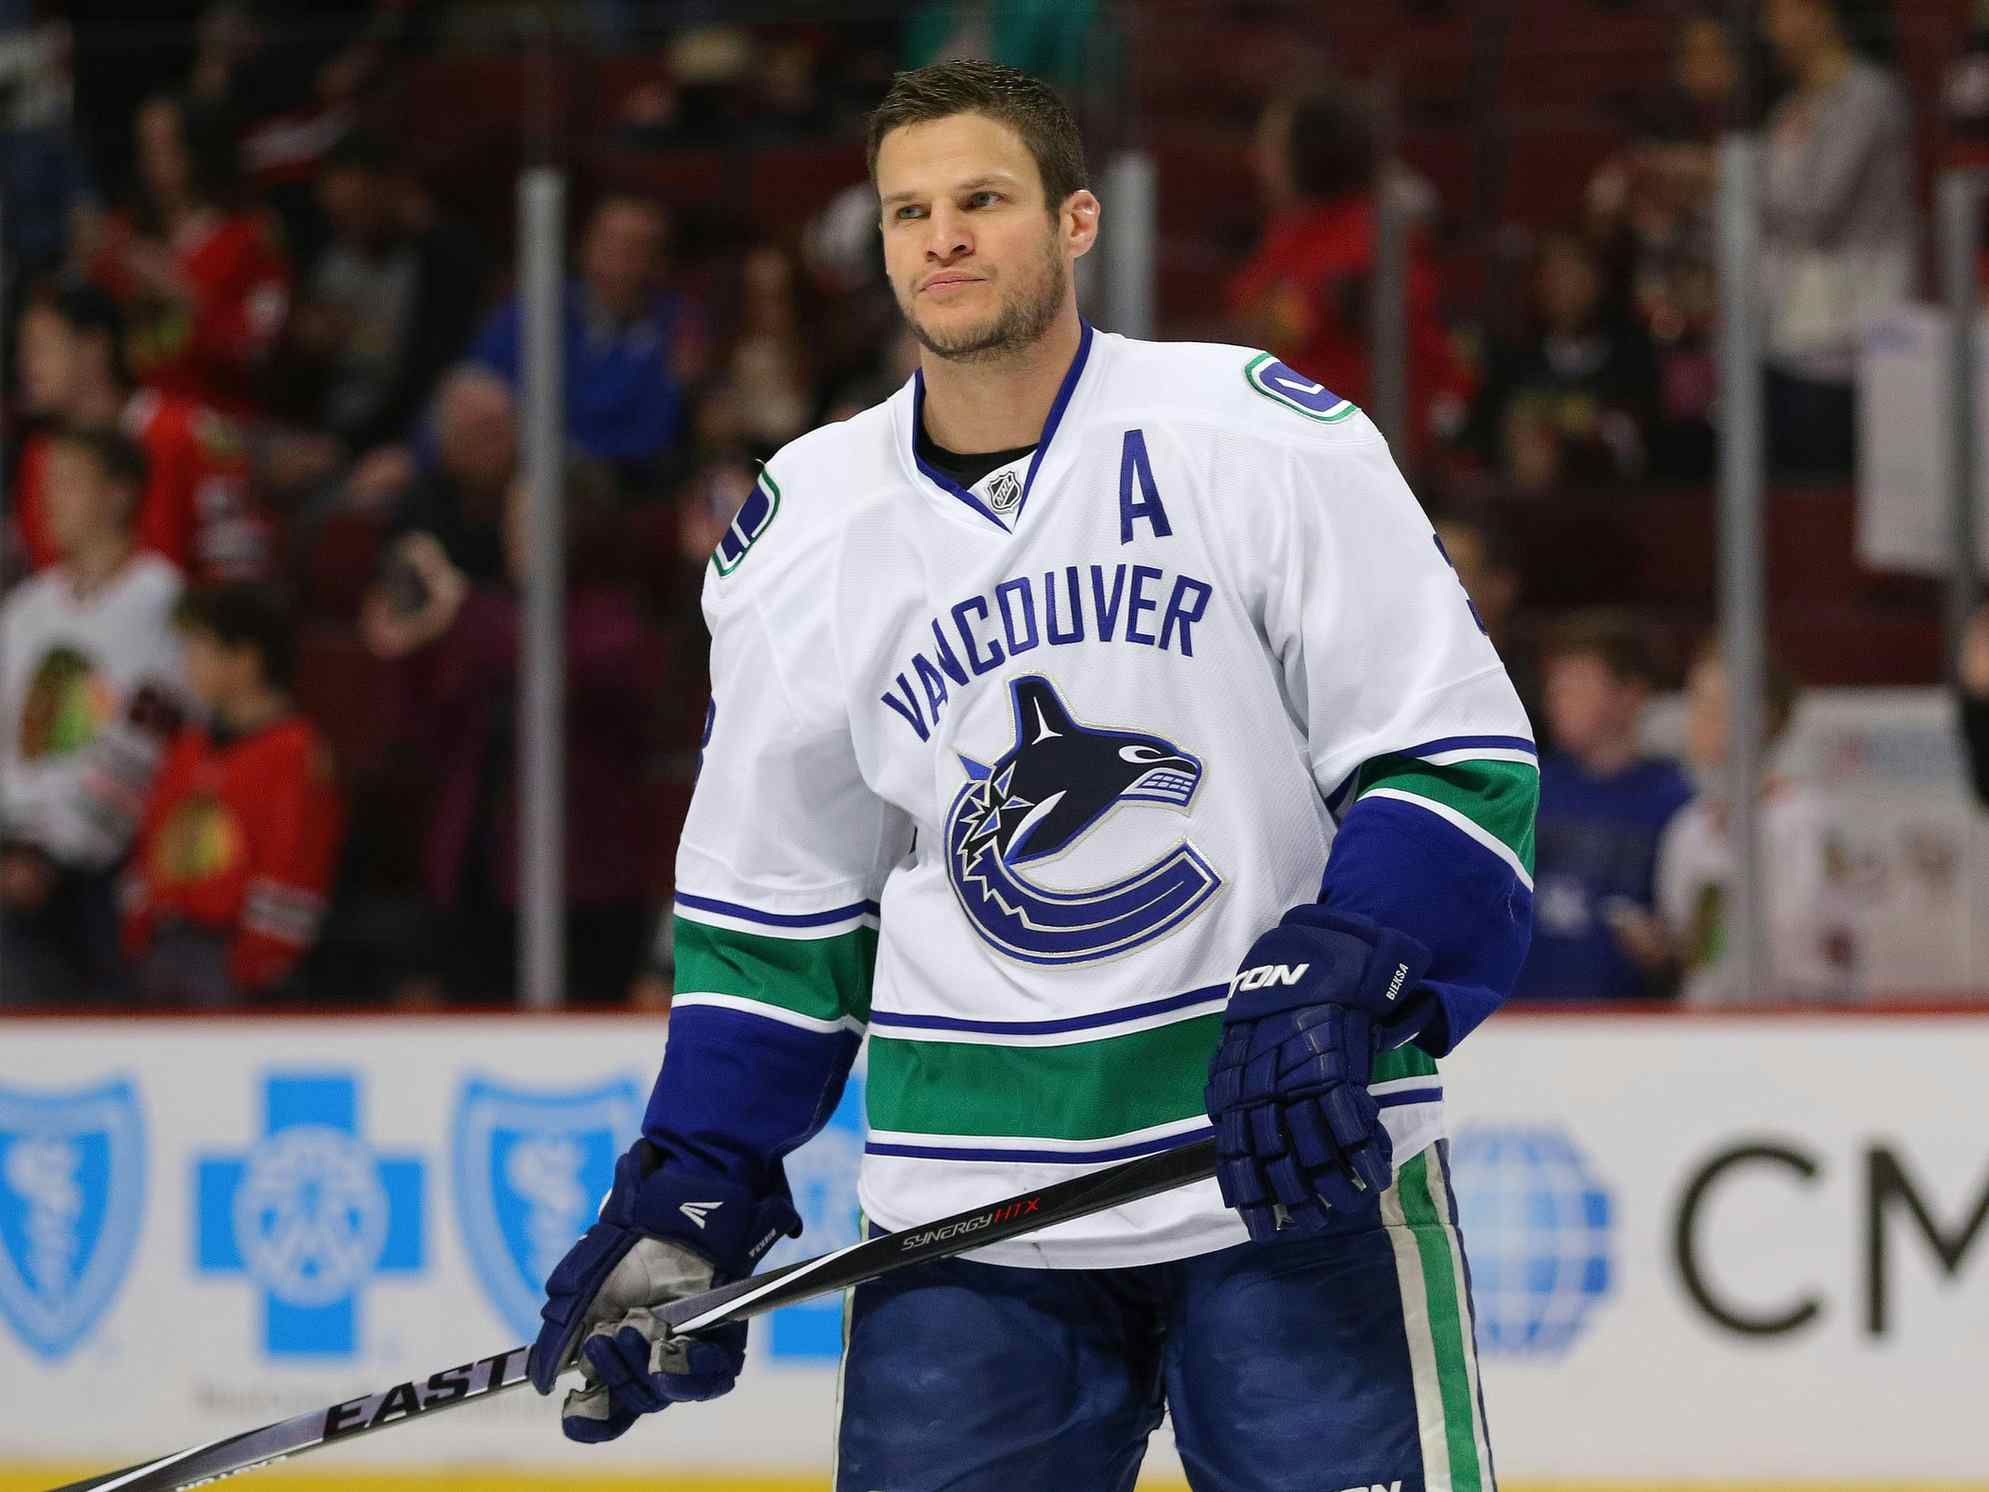
In terms of the Canucks, both Henrik and Daniel had achieved over 20 GAR seasons, Daniel in 2010-11 and Henrik in 2011-12, but those days are behind them. Last year, Daniel managing a 4.6 GAR, while Henrik was 11.9. Interestingly, the second Canuck to hit the 10-15 GAR plateau last year was none other than Alex Burrows, who has managed 5 over 10 GAR seasons over what has been a remarkable career, including an elite level 21 GAR year achieved in 2008-09.
Salary Allocation by GAR Band
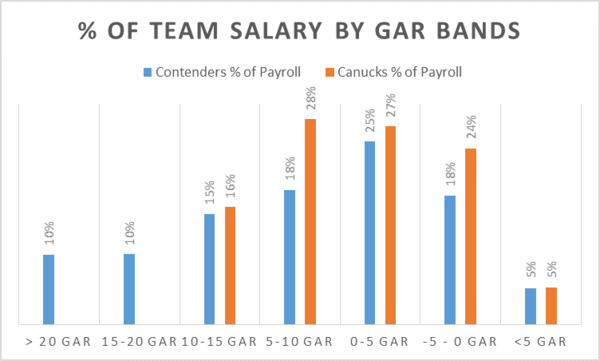
I thought it would be interesting to how contenders allocate their payroll versus the 2015-16 Canucks roster. On the bright side, it was interesting to note that on average, every contender (i.e. a team which made the conference finals) had roughly 5% of their cap allocated to their own “Sbisa” contracts (players will less than negative 5 GAR), but the more glaring issue is the the fact that a cap team like Vancouver doesn’t have cap space allocated to elite talent.
Now, it’s important to note the table above is a bit skewed because the Canucks don’t currently have any elite players (i.e. >15 GAR), so by extension they have a higher proportion of their salary allocated to lower GAR bands.
That said, the Canucks are a cap team, so its a bit disappointing that they have 51% of their cap allocated to low GAR bands (minus 5 to plus 5). That said, we can see that across the board, teams are allocating their precious salary cap inefficiently:

We can see that skaters above the baseline are providing value (measured by GAR) in excess of their AAV. We can think of these as either the really smart contract signings, but also the younger players still on their entry level contracts. The early Blackhawk cup winners benefited hugely from the low AAV allocated to a young Jonathan Toews and Patrick Kane, for example. The players below the line are those who are not providing value relative to their paycheck, but this is driven in part by market driven rates for older players who are not cost controlled under their ELCs. In short, as a result of both inefficient signings and the current CBA structure, the allocation of salary cap in today’s NHL is not efficient, but this isn’t actually new news.
Looking to next summer, the Canucks have roughly 25% percent of their current year cap is allocated to player who are not under contract for 2016-17, so they have some flexibility to allocate their cap more efficiently going forward.
Total Team GAR by Bands

It’s plain to see that the 2015-16 Canucks roster aligns slightly lower, in terms of overall GAR, than the non-contender teams, even before accounting for the impact of aging.
The most glaring holes are in the >20 GAR and 15-20 GAR buckets. Again, this doesn’t tell us anything we don’t already know – if the Canucks are to compete for a Stanley Cup in the future, these are the holes in their prospect pipeline that they’ll need to fill. They’re also the hardest holes to fill…
Others in this Series
Recent articles from money puck