How pGPS Values Draft Slots at the 2017 Entry Draft


By Jeremy Davis
6 years agoTime is ticking away until the 2017 NHL Entry Draft gets underway, and I’m sure everyone is bursting with anticipation. Unless you’re actually present in Chicago, there’s not much that can be done at this point except wait. Everyone passes the time a little differently. I pass the time by continuing to tinker with the mountain of draft data I have at my disposal.
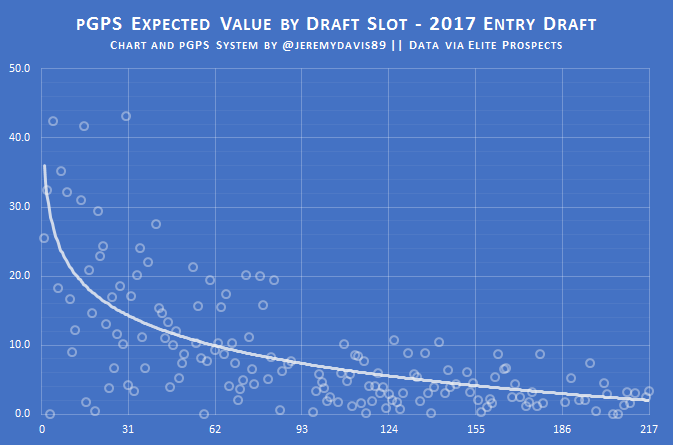
After last year’s draft, I ran through a series of posts that evaluated how each team did based on the value they extracted from the their draft slots. I plan on doing the same thing again this year, and as a primer to that, I’ve put together an expectation curve for the prospects available in 2017.
This graph is based not on previous drafts, but on this draft specifically. It is generated from the pool of prospects available in various feeder leagues, including first time eligible and overage prospects, and it demonstrates the expected value at each draft position according to the pGPS model. I think the graph should also do well in providing some context as to what are “good” and “bad” expected values for prospects. The top ten should be somewhere in the range of 25 or higher, while the rest of the first round ranges from about 15 to 20. It’s a steady decline after that, but we’d still hope for double digit value for any prospect in the top two rounds or so. The dots on the graph indicate players plotted by their consolidated draft rankings.
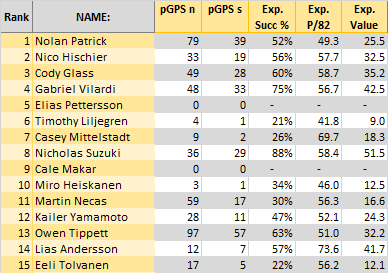
If you want to make some comparisons to how the best available prospect stack up, the expected values of each of our top 100 prospects are available in the table provided in the summary of our draft profile series. Here’s a quick example of the top 15 for easy reference.
Also of interest, I put together a chart that shows the total expected value for each team, based on where they are picking. After yesterday, Vegas is running away in the expected value race. If they use them appropriately, they could come away with one of the greatest individuals hauls in recent memory. Note that the value in this chart will change if and when teams make trades involving draft picks. This is accurate to about 2:30 p.m. on day one of the draft.
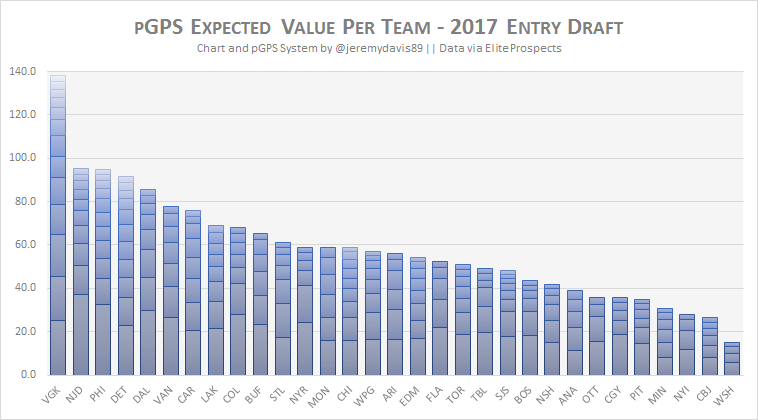
It’s important to remember that while accumulating draft picks is great, what you do with them is even more important. Look no further than the Bruins’ debacle in the first round of 2015 to see how quickly reaching on draft picks can erode the good will generate by bringing back good value in trades.
As for the Canucks, they’re projected to have the sixth highest values based on their draft positions, so hopefully Benning and co. pick to their potential.
Recent articles from Jeremy Davis