Fun With (Early Season) Numbers

11 years ago
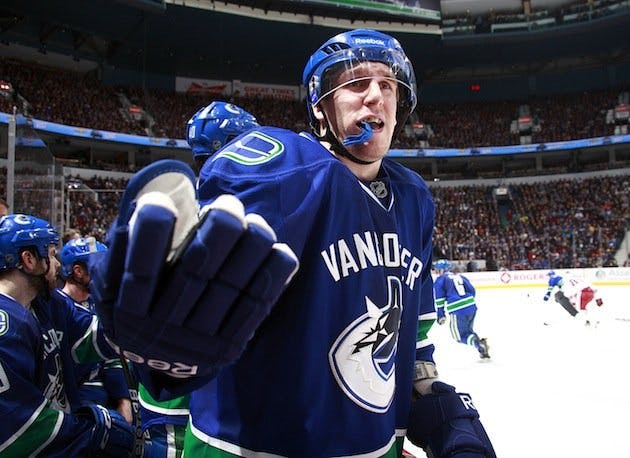
Hey, it’s not ol’ Dale’s fault he has such a punchable face.
We’re now 12 games in, which constitutes exactly a quarter of the 2013 NHL season. Something you need to keep in mind is that just because the season is shorter this year, doesn’t necessarily mean that the early season numbers carry any sort of added importance. As Cam Charron wrote a while back, the myth that a 48-game season changes things significantly has been circulated by fans and media alike because, hey, it makes for a far better story!
That takes into account team success, though. Individual performances will surely be skewed this season, at least to an extent. I do think that by the time the season wraps up, it will have provided us with some outlier paces; with the result being bad contracts handed out this sumer, and misguided evaluation of certain players’ abilities.
But that’s not our concern at the moment. We can only work with what we have, and that’s a 12-game sample of numbers. Let’s have some fun with them, shall we?
Read Past the Jump for More.
Different people do different things to occupy their time. Everyone is different. Me, personally? I take leisurely strolls through Behind The Net and the Hockey Analysis site. I look at numbers, and try to make sense of them. Below are some of the more prevalent Canucks-centric ones that I have come across most recently:
0: .. is the number of combined games for Ryan Kesler and David Booth this season. This has impacted on the Canucks on two fancystat fronts, in particular – possession metrics and flow starts. Booth and Kesler possess some of the best "flow" on the team, and their absence has certainly hurt the Canucks in the style department. The team could surely use 2 more bros such as themselves.
But all jokes aside, they’re also two of the Canucks’ best play drivers at even strength. You would think that without them, the team’s possession metrics would have taken a big hit in the early going, but that hasn’t really been the case..
53.7: .. is the team’s Corsi% in 5v5 situations this season. That’s good for 5th in the NHL. Basically, the Canucks are averaging 54.9 "corsi events" (shot attempts, including missed and blocked shots) per 60 minutes, while giving up 47.3 against. What’s more interesting to me, though, are their splits when they’re leading compared to when they’re trailing. In situations where the Canucks are trailing by 1 goal this season, they have been the best possession team in the league. When the roles are reversed and they’re up by 1, they’re a negative possession team.
And therein lies one of my favourite things about stats. The moment when the figures you see in the spreadsheet match up with what you’re seeing with your eyes during the game (assuming you actually watch the game, which most numbers guy don’t!). The Canucks have been downright brutal to watch late in games while holding a lead this season. They have taken the #trapitup strategy to a whole new level, clinging on for dear life. It’s gotten to the point where you’d like to see them trailing every once in a while, just to make sure that your soul doesn’t continue to slowly seep out of your body.
2.7: .. is the number of penalties per 60 minutes that Dale Weise is drawing in the early going. To put that rate into perspective, he’s in the top 10 in the entire league (amongst regular skaters) this season. Last year, he was at a rate of 0.9. Despite the fact that Weise has yet to register a point this season, he has been a valuable contributor to the team. He has further reinforced that you can be effective by simply being annoying as hell; a concept that Max Lapierre is quite familiar with.
Things are going well for Mr.Weise at the moment. He’s coming off of an otherworldly run in the Dutch League during the lockout, where he was the third biggest attraction in the Netherlands (behind marijuana and the Red Light District, of course). Plus, sources have told me that he is currently negotiating a deal for a biography to be written about him. Really the only thing holding it up is the fact that Jan Bulis is being a major diva.
14.3: .. is the shooting percentage for the Canucks when Jannik Hansen is on the ice. The Honey Badger had his best offensive season last year, when he posted 16 goals (nearly doubling his previous high). Considering the injuries the Canucks were faced with, there were expectations for him to take an even bigger step up coming into this season. And he hasn’t disappointed, putting up 7 points in the first 12 games.
Unfortunately, there are some red flags in the underlying numbers. The shooting % I referenced earlier is rather unsustainable, and leads the team by a fairly whopping margin. To go along with that, Hansen’s PDO of 110.4 is due for a precipitous drop-off in the near future. None of that is to diminish what he has done so far this season, because his play has been admirable. I have particularly enjoyed seeing him use his speed in concert with Mason Raymond and Jordan Schroeder. And if Devan ‘The Doobie’ Dubnyk keeps giving up goals like this one, maybe Hansen’s luck is here to stay.
.960: .. is Vancouver’s save percentage in 5v5 situations this year, which puts them at the top of the league. It’s not necessarily surprising that they’re at the top, considering they feature the league’s best 1-2 (feel free to discuss who is #1 and who is #2 in the comments section below, guys) tandem. However, their rate isn’t exactly sustainable, either. Their combined save percentages in the past two seasons were .933 and .930 in such circumstances. Expect there to be a few more high-scoring games once the level of competition ramps up.
Recent articles from Dimitri Filipovic