Canucks scoring chance totals: October

By Cam Charron
12 years ago
As you may have noticed, Thomas and I like to keep track of numbers. Some of those numbers are scoring chances. While a reader may dismiss Corsi (shot attempt differential) as not meaning much because the shot attempt doesn’t tell you the quality of a shot, scoring chance does.
When a scoring chance occurs, defined by Edmonton Oilers blog Copper n Blue as:
a clear play directed toward the opposing net from a dangerous scoring area – loosely defined as the top of the circle in and inside the faceoff dots (nicknamed the Home Plate), though sometimes slightly more generous than that depending on the amount of immediately-preceding puck movement or screens in front of the net. Blocked shots are generally not included but missed shots are. A player is awarded a scoring chance anytime he is on the ice and someone from either team has a chance to score. He is awarded a “chance for” if someone on his team has a chance to score and a “chance against” if the opposing team has a chance to score.
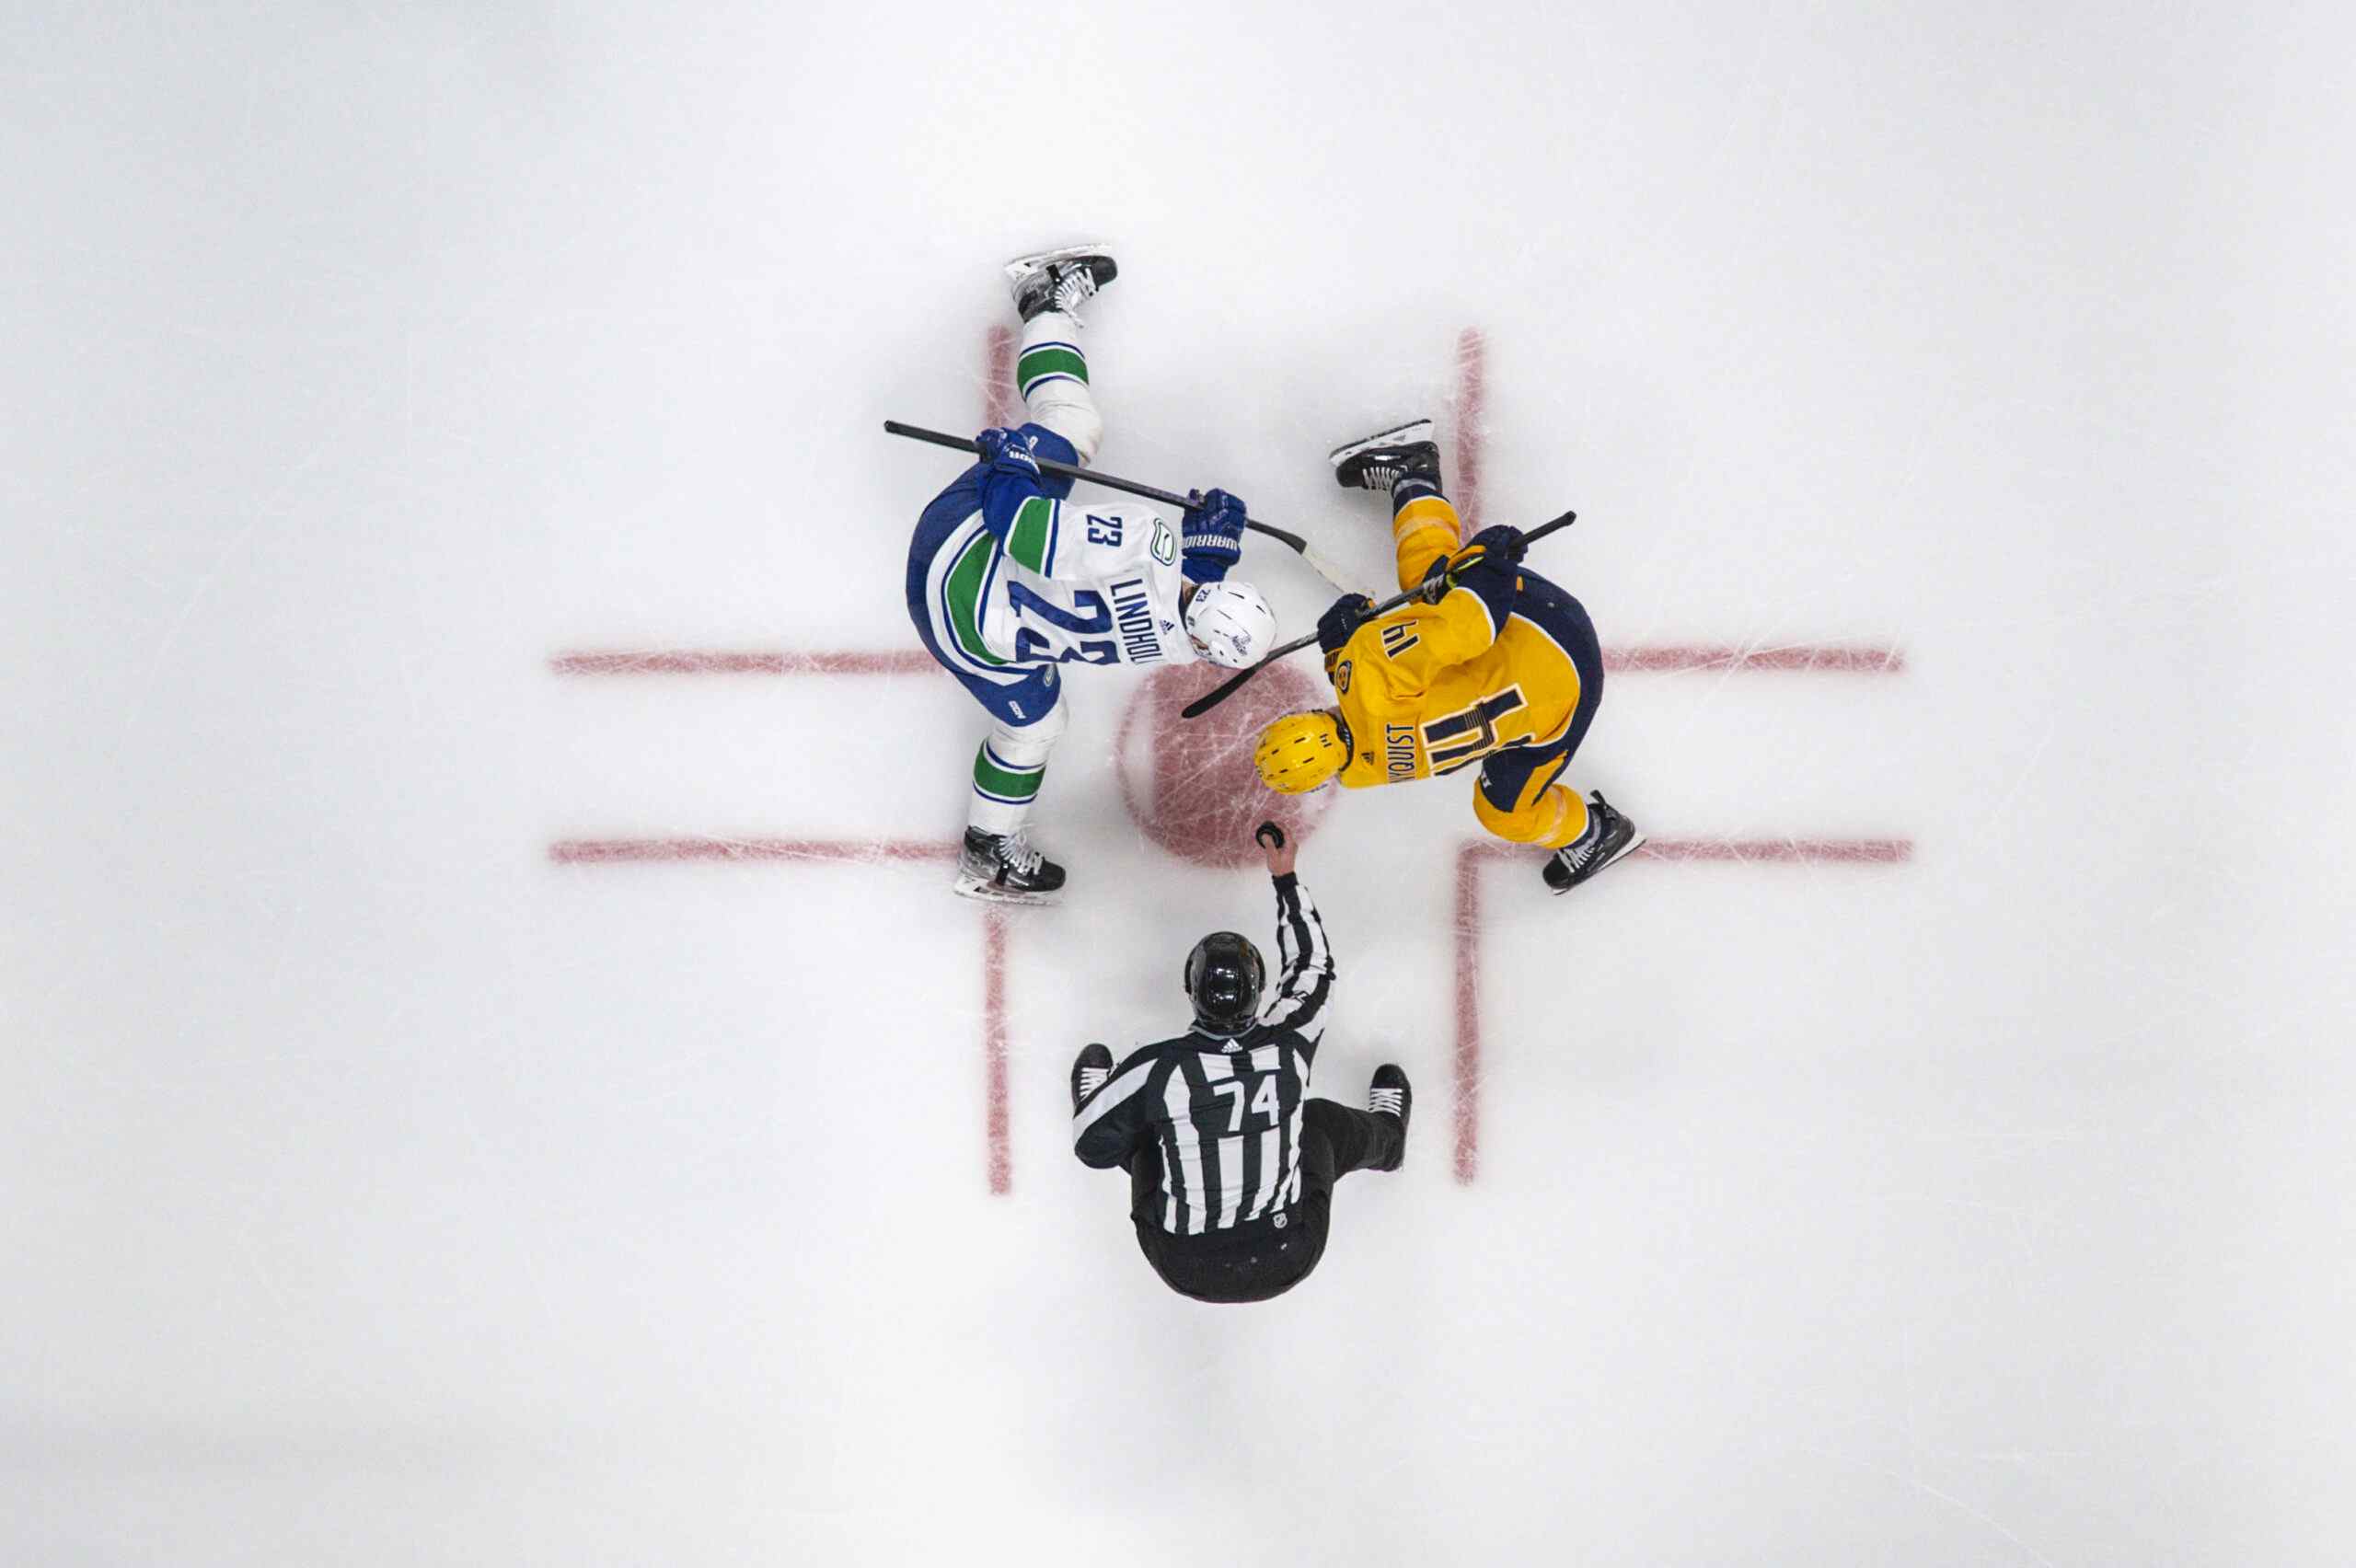
The picture above is what’s generally accepted as “the home plate area”. Anyway, you may see these numbers glossed upon after games, but I’ve tallied a total for the month of October so we can determine the best and worst Canucks over the past month.
One note, given the short-supply of chances on the powerplay, these totals only mark play at even strength. For forwards, I’ve averaged it out to 14.65 minutes per game as my standard, while defensemen play 17.5 minutes per game. This gives us a clear picture of how a player would do on a game-to-game basis if they were given top-line or second-line minutes.
First, the defense:
| # | Name | CF / 17.5 | CA / 17.5 | Diff / 17.5 |
|---|---|---|---|---|
| 2 | Hamhuis | 6.13 | 3.64 | 2.49 |
| 6 | Salo | 4.61 | 3.04 | 1.57 |
| 3 | Bieksa | 5.55 | 3.99 | 1.56 |
| 23 | Edler | 4.24 | 3.58 | 0.66 |
| 41 | Alberts | 3.12 | 3.12 | 0.00 |
| 8 | Tanev | 4.84 | 5.32 | -0.48 |
| 4 | Ballard | 3.78 | 4.86 | -1.08 |
| 52 | Sulzer | 3.57 | 6.63 | -3.06 |
What you may notice right off the hop is just how much better the Canucks have been from their opponents. More Canucks are in the positive differential than not, so it’s only a matter of time before the Canucks’ fortunes turn around and they start winning some more games.
Chris Tanev had a very rough start to the season and was sent down to Manitoba, and things aren’t looking good early on for Alex Sulzer. On the plus side, Dan Hamhuis is having an excellent start, while Sami Salo is the best defensive Canuck early on. Kevin Bieksa has a high-differential (if you followed my September series on player types, I’d call him high-event).
Worth noting with Sulzer is that he has the lowest offensive zone start rate (28.6%) among Canuck defensemen, so Alain Vigneault isn’t giving him a whole lot to work with. Chris Tanev was at 35.3% and Alexander Edler has a pretty bad differential considering he has the highest number of offensive zone starts (58.3%) among defensemen.
Let’s look at the forwards:
| # | Name | F/14.65 | A/14.65 | Diff/14.65 |
|---|---|---|---|---|
| 25 | Ebbett | 5.34 | 2.67 | 2.67 |
| 20 | Higgins | 4.85 | 2.48 | 2.37 |
| 17 | Kesler | 3.97 | 1.70 | 2.27 |
| 7 | Booth | 3.49 | 1.75 | 1.74 |
| 14 | Burrows | 4.54 | 3.55 | 0.99 |
| 33 | H. Sedin | 4.61 | 3.63 | 0.98 |
| 26 | Samuelsson | 3.76 | 2.87 | 0.89 |
| 9 | Hodgson | 3.50 | 2.68 | 0.82 |
| 15 | Sturm | 3.84 | 3.36 | 0.48 |
| 22 | D. Sedin | 4.04 | 3.69 | 0.35 |
| 32 | Weise | 3.04 | 3.04 | 0.00 |
| 36 | Hansen | 3.87 | 3.87 | 0.00 |
| 40 | Lapierre | 3.56 | 3.56 | 0.00 |
| 54 | Volpatti | 2.96 | 3.29 | -0.33 |
| 27 | Malhotra | 2.99 | 3.99 | -1.00 |
Andrew Ebbett has had some high underlying numbers in his limited time, despite just a 10.0% offensive zone start rate. His Corsi per 60 minutes is at 54.31 which is by far the highest on the team, so I’d like to see him get a little more playing time. There’s just nowhere in the line-up to slot him in. Manny Malhotra has had a noticeably rough start, but he’s playing against tough competition in tough scenarios again.
The Chris Higgins-Ryan Kesler-David Booth line, conventionally called the American Express line, but I like to call them “America! F*** Yeah!” line has done pretty well in their first three games together, so the goals should start to come for David Booth. The Sedins are not typically even strength players, doing the bulk of their damage on the powerplay, so I’m less concerned with the relatively low number off offensive chances they’ve created than I am with the high number of defensive chances against, given the sheltered minutes they play.
The fourth line has been very good. I’m usually quite critical of Aaron Volpatti, but that whole unit has played solid-if-unspectacular hockey and have kept goals off the score-sheet for the most part. I think that Dale Weise was a very excellent addition as it turns out.
Now, for goaltenders:
| # | Name | CF / 40 | CA / 40 | Diff / 40 |
|---|---|---|---|---|
| 1 | Luongo | 11.81 | 9.14 | 2.67 |
| 35 | Schneider | 10.83 | 10.06 | 0.77 |
This difference is over 40 minutes of game-time. Limited time shows that the team may play a bit better in front of Luongo (as indicated by chances for) but I think that Cory Schneider is worse on rebounds which may be why he has “given up” more scoring chances. If the trend continues over the course of the season, that’s an insinuation I’d be confident making, but without any hard evidence right now, these goaltender numbers are only trivial.
Recent articles from Cam Charron