Canucks Army Year in Review: Erik Gudbranson

By Harman Dayal
5 years agoErik Gudbranson’s merit as a top-four defenceman came into question in the aftermath of his first season as a Vancouver Canuck. Fast forward a year later, and Gudbranson has done little to silence the skepticism.
| Player | GP | G | A | P | 5v5 CF% |
| Erik Gudbranson | 52 | 2 | 3 | 5 | 43.8 |
Gudbranson’s already received his fair share of criticism from the analytics community, but his underlying numbers this season were unparalleled relative to even his standards. No NHL defenceman was worse than Gudbranson at controlling scoring chances, while only four fell short of him with regards to controlling shot attempts(minimum 600 minutes TOI). His woes didn’t end there either, with the former third overall pick setting a career-low in suppressing unblocked shot attempts per hour.
Subpar underlying results have been par for the course for Gudbranson, but it’s concerning to see how unfavourably they stack up to last season’s sample.
| Erik Gudbranson On-Ice | CF% | SCF% | HDCF% | xGF% | GF% |
| 2016-17 | 47.8 | 46.7 | 43.6 | 47.7 | 35.7 |
| 2017-18 | 43.8 | 41.0 | 43.6 | 43.9 | 42.6 |
The margin of discrepancy year over year is particularly alarming. The logical question to ask next is why do the Canucks find themselves knee deep in mud with Gudbranson deployed? A deeper look into the matter reveals that the root problem lies in the team’s inability to drive offence with the 26-year-old on the ice.
| Player(195 qualified NHL D) On-Ice | FF/60 | SCF/60 | xGF/60 | GF/60 | HDCF/60 |
| Erik Gudbranson | 35.4(3rd worst) | 21.3(6th worst | 1.75(2nd worst) | 1.59(5th worst) | 21.4(3rd worst) |
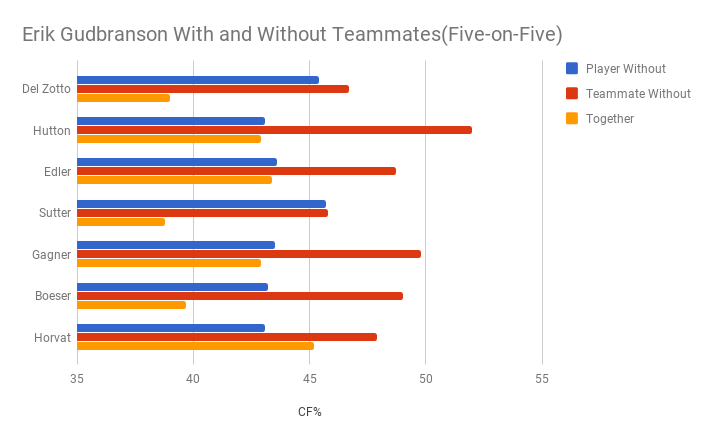
Vancouver’s offensive struggles with Gudbranson deployed are due in large part to his adverse effect on his teammates’ ability to control possession. Canucks’ skaters are nearly 5% worse at controlling shot attempts with Gudbranson on the ice compared to when he’s off. The difference is especially stark for his three most common defence partners.
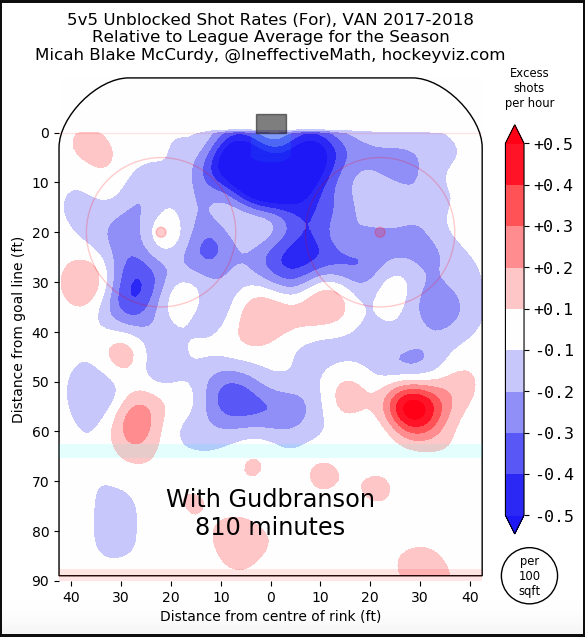
The silver lining in Gudbranson’s performance is that he actually did an adequate job defensively. The sheer volume of shot attempts against may be high, but his ability to prevent high-quality attempts translated to the second-best rates among Canucks’ defensemen for expected and actual goals against.
Unfortunately, those defensive contributions are essentially nullified by the ineptitude Gudbranson displays with the puck.
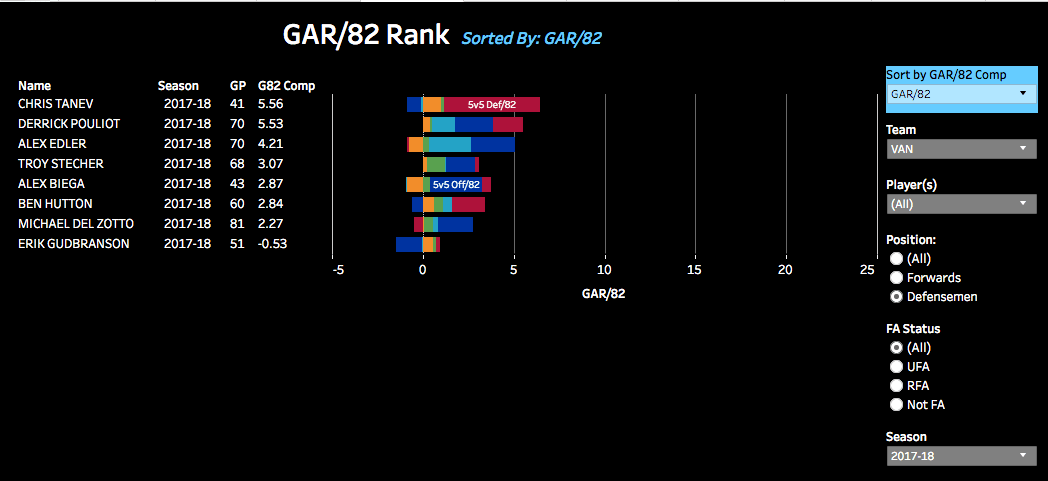
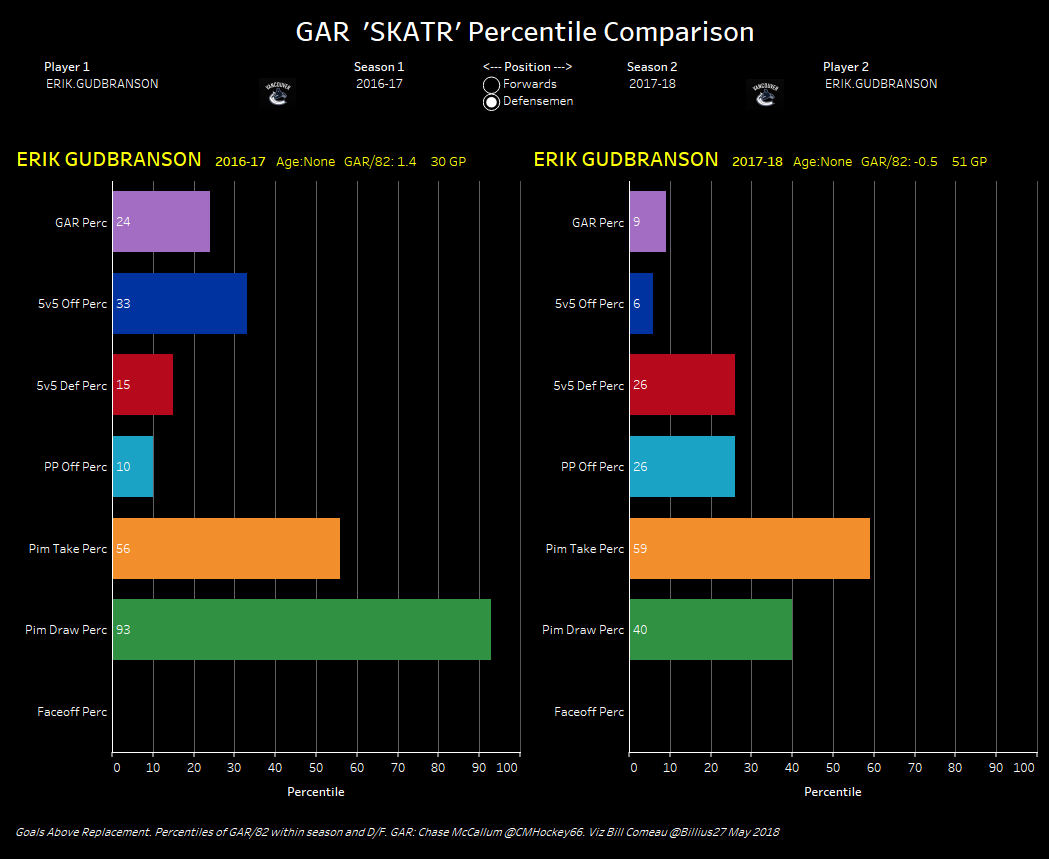
Chart courtesy Bill Comeau, GAR data courtesy Chase McCallum
Goals above replacement(GAR) is a single, composite figure that aims to encompass a player’s worth into one statistic. It isn’t perfect by any means, but it paints a pretty good picture of a player’s value. Gudbranson stands out as the only Canucks’ defenceman performing below replacement-level.
Breaking things down compared to last year reaffirms the assertion that it was Gudbranson’s offensive detriment that proved costly.
One facet that the GAR metric doesn’t take into account is penalty killing performance — a noted strength for Gudbranson. Surprisingly, a first glance at the shorthanded results leaves you scratching your head.
| Canucks’ D PK On-Ice | TOI | FA/60 | GA/60 | xGA/60 | HDCA/60 |
| Stecher | 101.25 | 66.96 | 5.33 | 5.59 | 15.84 |
| Tanev | 126.78 | 70.04 | 8.05 | 5.91 | 17.39 |
| Edler | 184.47 | 72.21 | 9.76 | 6.19 | 19.37 |
| Del Zotto | 173.63 | 72.57 | 8.29 | 6.58 | 16.1 |
| Gudbranson | 130.31 | 73.77 | 10.6 | 6.71 | 19.63 |
| Hutton | 95.03 | 62.51 | 6.31 | 7.87 | 21.72 |
Gudbranson was outperformed in every defensive metric by Troy Stecher and Chris Tanev — the two other right-handed penalty killing options. The glaring deficiency with Gudbranson’s results is his paltry goals against rate — one that ranks sixth worst among defencemen league-wide(minimum 100 shorthanded minutes).
Contextualizing the numbers highlights that Gudbranson’s shortcomings relative to his peers speaks more towards the proficiency of their play than it does about the inadequacy of his own performance. Gudbranson’s conspicuously poor goals against rate was skewed by a .813 save percentage that ranked eighth lowest among all penalty killing defencemen. On the other hand, his expected mark appeared underwhelming compared to his teammates, but it was actually good enough to slot into the top quarter among 119 qualified blueliners.
How Can The Canucks Get the Most Out of Gudbranson?
A defenceman’s fit with his partner is an underrated factor for on-ice success. For Gudbranson, that’s been an issue since day one in Vancouver when he was paired with Ben Hutton.
The key for Gudbranson going back to his Florida days was finding a partner that could make up for his puck-moving deficiencies. The Canucks might not have a player of Brian Campbell’s quality like the Panthers did, though they do have a blueliner who shares some of the same strengths in Derrick Pouliot.
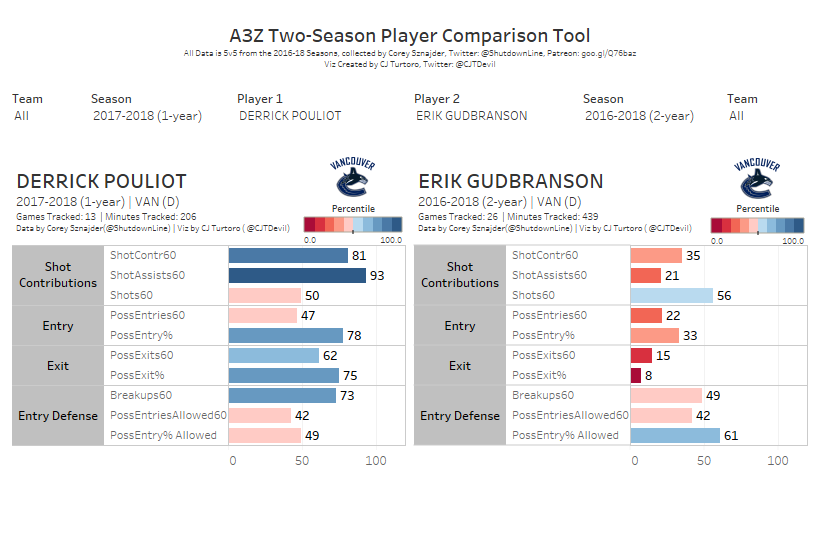
Not only was Pouliot the only Canucks’ defenceman to crest a 40% possession exit rate in Corey Sznajder’s sample, but his playmaking acumen shines through in his shot contribution data. Pouliot’s attacking skillset would take a lot of pressure off of Gudbranson, with the latter making up for Pouliot’s defensive inconsistencies.
If this rationale sounds familiar to you, it’s because a similar one was applied with Ben Hutton prior to Gudbranson’s arrival in Vancouver. The difference this time around is that there’s already a limited sample size that corroborates the validity of a Gudbranson and Pouliot pairing.
| 5v5 On-Ice 2017-18 | TOI | CF% | Rel FA/60 | xGF% | GF% | GF/60 | GA/60 |
| 44 & 5 together | 100.58 | 51.1 | -2.9 | 49.6 | 50 | 2.39 | 2.39 |
Pouliot was by far Gudbranson’s best partner this season. The duo finished in the black for managing shot attempts, goals, and had the lowest unblocked shot attempts against rate of any pairing with Gudbranson on it.
It is important to note that the pairing likely received easier matchups, but if that’s what it takes to get the most out of Gudbranson, then so be it.
After all, what is there to lose?
Recent articles from Harman Dayal