Beware of what a defenceman’s points are(and aren’t) telling you

By Harman Dayal
5 years agoPoints totals aren’t always entirely reflective of a defenceman’s offensive contributions.
As counterintuitive as this sounds, it begins to make more sense when you examine the fundamental reason as to why we care about them in the first place.
People value points because we’re led to believe that the more a player collects, the better he is at helping his team score goals. While that’s proven to be true for forwards, there doesn’t actually appear to be much of a correlation for defencemen.
A quasi-study conducted by Travis Yost found that there isn’t a meaningful connection between the rate at which a defenceman generates shots and points and a team’s scoring rate with that defender on the ice.
In other words, your team won’t necessarily score more just because a point producing defenceman is on the ice. It sounds silly, but Yost’s reasoning for why this paradox exists doesn’t sound unreasonable.
Yost found that a defenceman’s goal and assist totals are tied closely to the rate at which they shoot the puck. This contrasts forwards, who only see a relationship between shots and goals. In simpler terms, it means that the more a defenceman shoots, the more likely they are to get points.
Based on this, you might be duped into thinking that it’s in the teams best interests for defencemen to shoot the puck. But as we mentioned at the start, there’s no correlation between the rate at which a defender registers shots and the scoring rate of his team while he’s deployed.
A reason for this missing link is because there’s an opportunity cost every time a player attempts a shot. Every time a player shoots, he’s forgoing the chance to make a pass that could eventually lead to a more dangerous shot.
Opportunity cost is a lot more relevant for defencemen. Shots from the point are largely inefficient as they have just a 3% chance of going in. In most cases, you’d be better served as a blueliner to make a pass to keep the play alive rather than fire a long-range shot.
The problem as you’ll recall is that the existing points model rewards the opposite – defencemen pick up points in relation to their individual shot volume.
As Yost mentioned in his article, this often leads to situations where defencemen accumulate vacuous assists.
What should we be using to evaluate a defenceman’s offensive contributions?
If points alone aren’t enough to measure a defencemen’s offensive contributions, what else should we rely on?
Transitional play sticks out as an overlooked component of offence. A defenceman who’s able to move the puck out of the defensive zone and/or into the attacking area with possession creates a territorial scoring advantage for the rest of the team, even if that player doesn’t receive credit in the form of points.
Unlike a defenceman’s individual points rate, effectively moving the puck up the ice is statistically proven to improve the team’s overall scoring proficiency. Zone exits with possession improve the rate for possession zone entries – the latter of which are nearly twice as effective at producing shots and goals than dump-ins.
In terms of offensive zone play, I tend to lean on Ryan Stimson’s data. Stimson’s passing project tracks passing sequences in an attempt to measure pre-shot movement – a critical, yet underrated part of scoring goals.
At a team-level, his passing model is one of the most powerful public tools – more predictive for future scoring than shots, goals and other expected goal models.
For defencemen, primary shot contributions(primary shot assists + shots), as well as Stimson’s expected primary points per hour metric, are better at predicting future primary points than a player’s past primary points.
Explained more simply, primary shot contributions and expected primary points are better tools at predicting a defenceman’s future point totals than past points themselves. This means that we can rely on those two metrics to identify players that have counting stats that aren’t commensurate with their true offensive contributions.
An example of this that Canucks’ fans can relate to is Ben Hutton. The former fifth-round pick led Vancouver’s blueline in scoring with 25 points in his rookie season, even though Stimson’s expected primary points metric pegged him at a bottom 20th percentile rate for the 2015-16 season.
Since then, Hutton’s point production has fallen in consecutive seasons to align closer to the scoring pace that the model originally projected. If we considered this data back then, we might have been able to foreshadow a regression and temper expectations accordingly.
Stimson’s passing model also includes a stat that quantifies the percentage of on-ice shots that a player contributes to. This tells us how frequently offence flows through a player, which can work in conjunction with their individual point percentage to give us an idea of whether a defenceman’s point totals are misleading.
In summation, here are the tools and factors I take into account when analyzing a defencemen’s offensive profile.
- Primary Points
- Expected Primary Points Per Hour
- Primary Shot Contributions
- Defensive zone exits
- Offensive zone entries
- SCB %(on-ice shot contribution percentage)
- Individual Point %(Percentage of on-ice goals a player gets points on)
- Deployment(Teammate and competition quality, zone starts, special teams opportunities)
Case Study: Troy Stecher and Alex Edler
A 13 point decline compared to his rookie season left many fans disappointed with Troy Stecher’s offensive play.
Peel back the layers of his offensive performance though, and you’ll come to realize that his lacklustre production was the product of deployment changes and poor luck rather than inferior individual play.
The first factor to consider is that Stecher spent less than 20 minutes on the man advantage this season after leading Canucks’ defencemen in power-play time-on-ice in the season prior. By that virtue, it’d be fair to start by isolating even-strength performance for both seasons.
There’s still a notable discrepancy – 16 points in 2016-17 compared to just nine in the most recent season – but if we take a look into some of the underlying numbers we can immediately point to luck as one cause of this difference.
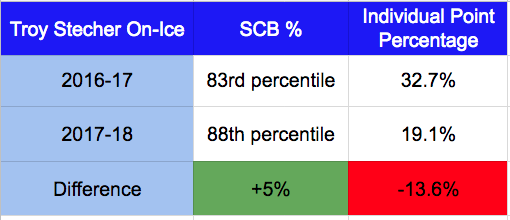
Ryan Stimson’s tracked data suggests that Stecher was more involved with the generation of on-ice shots and thus the flow of offence compared to last season. Despite that, he saw his individual point percentage(the percentage of on-ice goals a player gets points on) plummet compared to both last season and the 30% league average for defencemen.
Perhaps most surprising is that every offensive evaluation tool I value pointed to this season as a tangible step forward for Stecher.
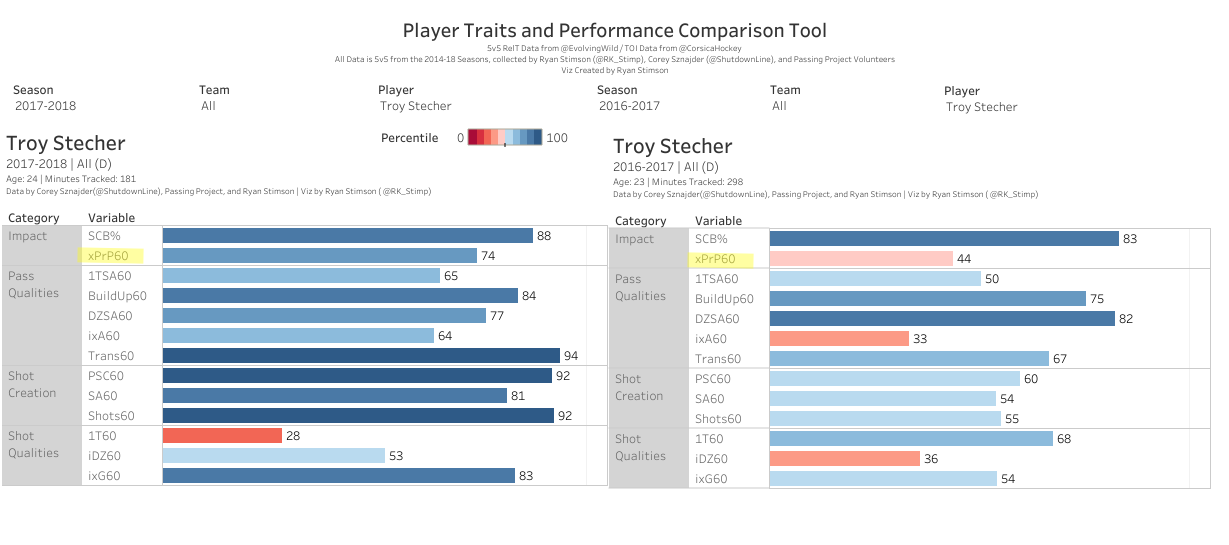
The 24-year-old’s expected primary points rate for last season had him producing at a first pairing rate, if only barely. A big reason for this is because of the drastic improvement in his transition game – Stecher ranking among the 94th percentile in the NHL for shots and shot assists generated from plays that began in the defensive or neutral zone(Trans/60).
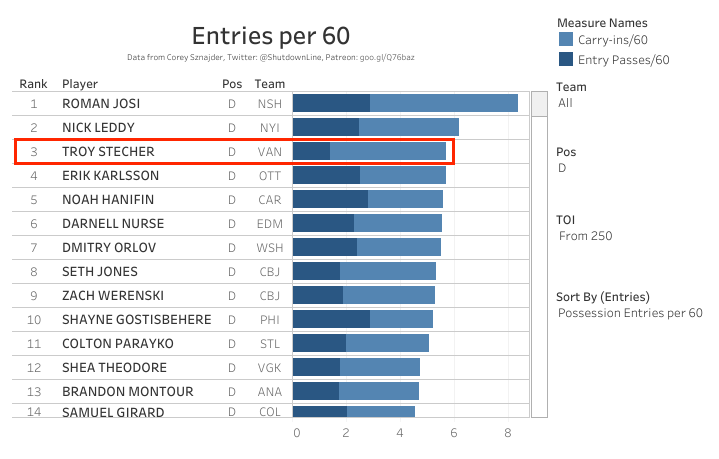
Such proficiency is equally impressive by Corey Sznajder’s neutral zone data, which ranked the Richmond, BC native as the third-best NHL defencemen at leading offensive zone entries with possession.
Given that strong transition play increases shot rates, it shouldn’t come as a huge surprise to hear that Troy Stecher was top-10 in the league for primary shot contributions as well. In fact, he was one of nine defenders to finish in the top-30 for shot contribution and entry rates alike.
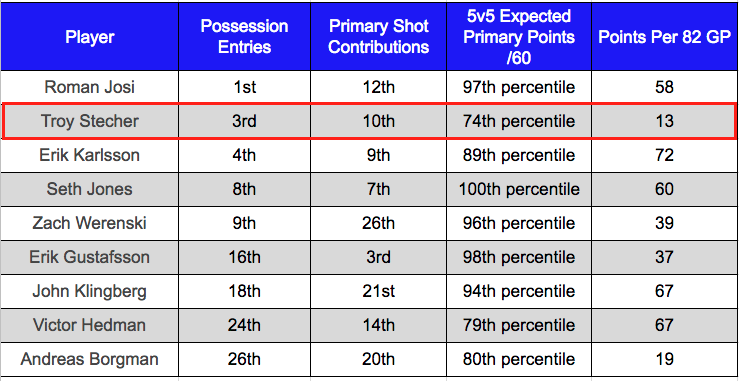
Data courtesy Corey Sznajder and Ryan Stimson
Points, of course, still hold value. Stecher’s underwhelming counting stats speak towards his poor wrister and mediocre decision making upon entering the zone, though his rate of entries and shot contributions still created an impact that probably wasn’t reflected in his point totals.
Contrast his underlying playmaking profile with blueline scoring leader Alex Edler and you’re left wondering if raw point totals are telling us the whole story with regards to offensive play.
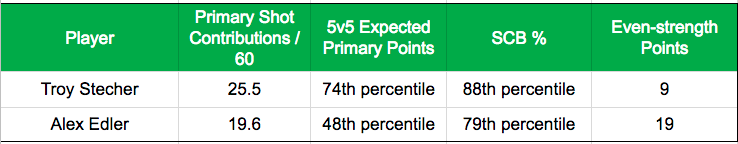
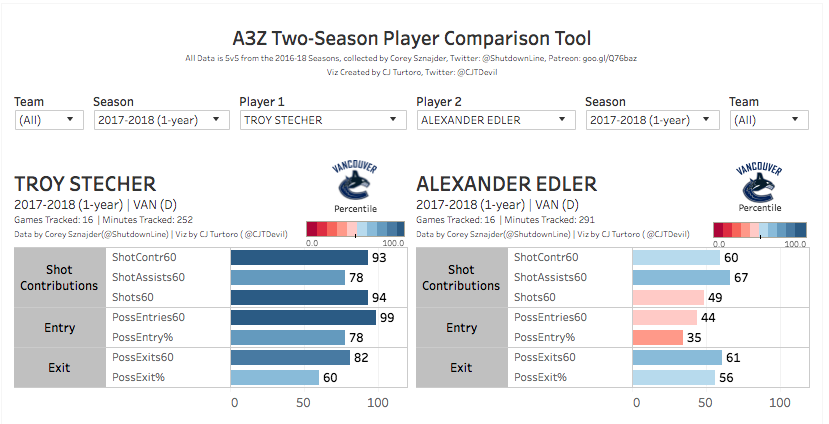
Data courtesy Corey Sznajder, viz by CJ Turtoro
The comparison becomes even more interesting when considering that the Canucks generated goals and scoring chances alike at higher rates with Stecher on the ice than Edler; albeit by a small margin.
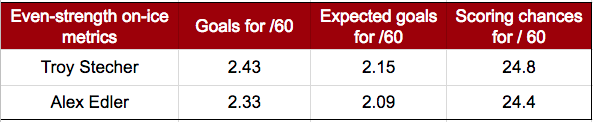
Data courtesy Natural Stattrick and Corsica
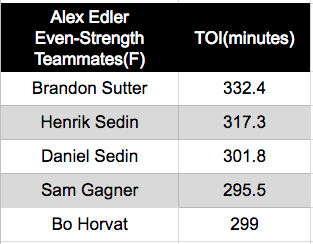
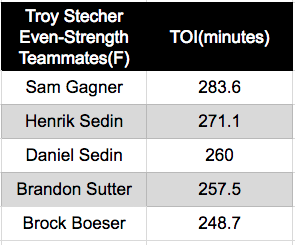
Contextual differences(teammate and competition quality) often skew on-ice results, but they’re more relevant in this scenario as the pair shared four of their five most common teammates up front, while also both receiving competition commensurate with first pairing defencemen.
Putting all this information together creates a conflicting picture that leaves you with more questions than it does answers. Despite a stark difference in points, not only did Stecher drive plays conducive for goals at superior rates than Edler, but the team generated scoring chances and actual goals at higher rates with the 24-year-old on the ice.
A situation like this coupled with Yost’s research on points from defencemen leaves me wondering if the offensive disparity between Edler and Stecher is truly as large as the public perception.
Conclusion
The point of this article isn’t to defend Stecher or undermine Edler’s raw production – the data tracked by Sznajder and Stimson isn’t large enough to draw definitive conclusions for this situation, even if microstats normalize after 15-20 games worth of tracking.
Instead, my objective is to challenge the simplistic method of evaluating defencemen solely based on points. Boxcar stats are always going to be a convenient and effective measuring stick to use, but we’d be doing ourselves a disservice by not also using the public tools and metrics at our disposal.
Recent articles from Harman Dayal