


If you’re a regular reader here at Canucks Army, you are likely familiar with most of the new stats that we use to analyze players and games. Sure, everyone likes a good story, but good stories don’t win you the Cup. Not Cinderella stories, not chronicles of heroism, and certainly not a tale of destiny. Sigh.
No, what wins you the Cup is good old fashioned luck.
Ok, maybe I’m oversimplifying that, but when you did down to the root of the matter, the NHL results are indistinguishable from a league in which 76% of the games are decided by random chance. In other words, the better team will win 24% of the time due a higher skill level. The rest of the time, it’s a toss up.
That means in a seven game series, the better team will win one, maybe two, games due to a skill advantage. The rest is up to Lady Luck.
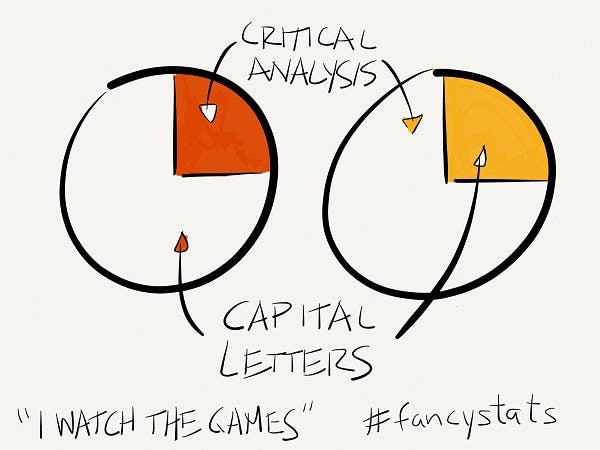
So keep that in mind next time you hear another storyline disguised as analysis from an expert on a TV panel:

And that’s really at the heart of the work that has gone into tracking and analyzing advanced hockey statistics. It’s just some pretty knowledgeable hockey fans trying to find ways of quantifying what actually happened.
Traditional Stats
Anyway, back to the role of luck in the NHL and why that even matters. If you consider that team level results are simply the sum total of individual player performances, it is not too great a stretch of logic to assume that luck plays a pretty significant role at the player level as well.
The fact is that goals are pretty rare events in a hockey game. And given that luck plays such a big role in whether or not a puck actually gets into the net, the level of uncertainity around goal scoring is going to be very high. This is, I believe, the single biggest non-intuitive idea you need to grasp in order to understand advanced hockey stats.
Yes, skill clearly plays a part. But luck plays an even larger part. That’s why it’s not really useful to base any kind of meaningful analysis on goals, which are just a likely to bounce in off a leg as to be the result of some measurable skill on the part of the shooter. And if goals on their own are almost meaningless, then don’t get me started on plus/minus:
That’s just one of the traditional hockey stats that is constantly referenced to fit some predetermined narrative or other. The worst example is when the so-called experts ADD +/- STATS TOGETHER to say that player A and player B are a combined -251 in the last year. This is especially frustrating because the players being aggregated are usually linemates or defense partners, which means that they were probably on the ice for many of the same goals for/against that go into that particularly heinous stat. GAAAAAAAAAH!
Ok, deep breaths. Let’s not talk about +/- any more.
Of course, most of the other common stats that on-air analysts refer to are just as meaningless. You need look no further than Saturday’s post-game show following the Canucks/Oilers game, where Glen Healy actually said these words:
“When you look at the stats, every stat was in Edmonton’s favour. Faceoffs, they were better in faceoffs, They were better in hits. They had more blocked shots. But they weren’t even in the game.”
Let that sink in for a second.
This is a game that the Canucks clearly dominated from start to finish. Yet the stats that Healy counts on were ALL in Edmonton’s favour. Shouldn’t you think about looking a different stats then, Glen?
Here’s what you would have seen if you looked at just one of the advanced stats that’s available:

Does that maybe match up a bit better with what your eyes told you on Saturday night? Here’s the rest of the advanced stats on the game, which all show what a dominating performance that was by the Canucks.
That chart and data is from the excellent new Extra Skater website that is wrapping a really easy to use interface and navigation around stats that have been tracked for years on Behind The Net, Time On Ice and Hockey Analysis.
Shooting Stats
So what stats do matter? Well, there’s two key components factors that go into making a stat useful. The first is that it should have some relationship to the outcome of hockey games. The second is that it should help us weed out the effects of luck in some way. Oh, and I guess there’s one more rather important factor to consider: is it countable?
Probably should have started with that last one…
It turns out that shooting at the net meets all of our requirements. It should be intuitively obvious that you are more likely to win a hockey game if you have the puck. Not only does that mean you have an opportunity to score, but the opposing team doesn’t. The NHL used to track possession times, but they stopped a few years ago. However, shot attempts are a pretty good proxy for puck possession. Clearly the more shots you take at the net, the more you have the puck.
Don’t believe me? Well, J.P. Nikota over at Pension Plan Puppets got out his trusty stopwatch and timed possession times for the Leafs’ games last year. This is what he found when he plotted offensive zone time with shot attempt differential:

That’s a pretty good correlation, I’d say.
The other reason shots and shot attempts are a good statistical base for analyzing hockey is that unlike goals, they are not rare events. There are usually over 70,000 shots on goal in the NHL every year, and about double that number in shot attempts. Compare that with just under 7,000 goals.
Why is the number of events so important? Because the larger the sample, the less impact randomness and errors will have on the results. So looking at shot attempts helps to smooth out the effects of chance or luck that you get when focusing just on goals.
Finally, the NHL actually counts shots and shot attempts for us! So really the only advanced part of most advanced stats is the use of addition and subtraction:

I guess plus minus is useful after all.
What The Hell Is A Corsi?
Now, you might have looked at that chart from J.P. Nikota above and thought to yourself, “What the hell is a Corsi?” Well, I’m not going to get into where the term came from, but suffice it to say that Corsi refers to shot attempt differential. At the team level, that just means you add up all shot attempts for one team, including those that were blocked or missed the net, and subtract the shot attempts for the other team. At the player level, you do the same thing for all shot attempts for and against while that player was on the ice. The result can be expressed as a positive or negative number, or more often as a percentage. The latter is calculated simply by dividing shot attempts for by total shot attempts by both teams.
There are a number of variations on Corsi that try to factor in things starting from a face-off in the offensive or defensive zone, quality of teammates, quality of opposition, etc. One of the more common is CorsiRelative. Note, this is has nothing to do with that drunk uncle that shows up to all your family events:
No, CorsiRelative is the difference between an individual player’s Corsi while he is on the ice and the rest of the team’s Corsi while he is off the ice. This helps to pick out players that might be driving possession even though they play on a horrible team.
Another key filter applied to shooting stats is the game state. First of all, most shooting stats only account for things that happen at even strength. Clearly if one team is on the power play, they are going to have the puck most of the time and get the majority of the shot attempts. So you don’t want that to skew the overall results. The other thing that tends to affect possession and shot attempts is the score. There has been plenty of work to show that when a team is comfortably ahead, they tend to sit back and protect the lead.
So you will sometimes see people referring to score-tied or score-close Corsi. This just means that only shot attempts while the score is tied or close (within one goal) are counted. Score effects are something that Canucks fans are very, very familiar with:
Just don’t tell Canucks fans that all teams in all sports go into a defensive shell when they’re comfortably ahead.
Ok, I Get Corsi, But Fenwick? WTF Is That?
Fenwick is just like Corsi except it does not include blocked shots. Here’s a handy chart to help you tell the difference between all the advanced shot stats:
If anybody was counting shots that bounced at least once on the way to the net, we’d have to call that a Lidster.
Anyway, based on quite a bit of statistical analysis over the last few years, Fenwick Close or Fenwick Adjusted (for score effects) are generally accepted as the best predictive stats over a given NHL season. That’s why you’ll often see Fenwick Close referenced when talking about a given team’s performance to date and how you might expect them to perform in the future.
PDO: The Most Obscure Of All Advanced Stats
Look, I’m not going to explain this one. If you want and explanation, our very own @camcharron provided one over at Backhand Shelf earlier this year. Suffice it to say that over time the sum of a team’s shooting percentage and save percentage will asymptotically approach a value of 1. Sometimes you will see it represented as values around 1,000 but that’s just for people that hate decimal points.
Why is PDO useful, well, as Cam put it at the top of weekly tabulation of PDO numbers by team last season:
Basically, if a team is playing with a PDO number way higher than 1.000, they’re producing above their expected output. If a team is playing with a PDO number below 1.000, they’re producing below their expected output. Over the course of a long season, the number will generally correct itself.
Although PDO was developed as a team level stat, it applies at the individual player level as well. If your favourite player appears to be struggling, check out his PDO. If it’s really low, he’s probably just had a stretch of bad luck where he and his linemates have had a really low shooting percentage and/or the goaltending has been below par while he’s on the ice. Over time, the bounces will even out.
As for what PDO actually stands for, nobody really knows, but I think it’s pretty darn obvious:
Extra Skater includes the PDO calculation in their advanced stats tables at the team and invididual player level.
But What About Shot Quality
Yes, yes. Not all shots are created equal. A screen shot from the blue line is not the same as an open look from between the hash marks. True.
But two things to consider. First, while shot quality is undoubtedly a thing, it’s impact is actually quite small. You can find pages and pages online of pixels spilled in the shot quality debate. But at the macro level, any impact of shot quality is going to be lost in the noise and normal fluctuation produced by luck and any other factors that are not quantifiable. And that’s the second thing, nobody has found a way to quantify shot quality.
Is it based on distance? Location? Just an innate ability? Well how would you measure that last one?
One of the most objective attempts to filter out some of the noise and focus on shots that should matter has been the work done to count scoring chances over the last few years. The recaps right here at Canucks Army include counts of chances for and against for most games. Last year, these results were combined with similar counts from around the league to allow for a meta analysis of scoring chance data.
The results showed that scoring chances correlated really, really closely with Fenwick. So, sure, you’re much more likely to score on a shot from the roughly triangular region between the net and the two face-off circles, but you’re also more like to get scoring chances proportionately to your overall shot attempts. Basically you should draw similar conclusions from scoring chances as you would from the shot counting stats, but counting chances is way more labour intensive while shot counting stats are readily available.
That being said, there is one factor that is very strongly correlated to scoring chances:
Hopefully this provided a little more insight into what the most common advanced stats are and why we use them as the basis for our analyses here at Canucks Army. There are plenty of resources around the web on the topic, and the NHL Numbers site on the Nations network is one of them.
One other site that you might find cool is ShiftChart.com, which lets you see who was on the ice at any point during a game in a super easy to use and very versatile graphical format.
We’re on the verge of a breakthrough in the tools available to generate some real insights on what drives results in the NHL. So if you’re at all interested, dig in and play with the numbers yourself. Either way, keep some of this in mind next time Glen Healy seems perplexed when he’s looking at stats sheet.
Maybe he should stop worrying about face off percentage, hits and blocks shots and just watch the games.
