The Canucks Are Winning a Lot of Face-offs This Year, But Wins Don’t Matter As Much As What Happens After
By Jeremy Davis
4 years agoDespite a recent slide (before an even more recent winning streak), the Vancouver Canucks certainly look to be an improved squad relative to last year. The currently hold a points percentage of 0.523 compared to last season’s 0.494. Among the other statistical categories in which they have shown in improvements are goals per game (3.18 compared to 2.67), power play percentage (26.0% compared to 17.1%), shots per game (31.7 compared to 29.7), unblocked shot share (50.2% compared to 47.6%), and expected goal share (50.3% compared to 45.8%).
They’ve also improved markedly in the face-off dot, increasing their face-off win percentage from 49.5% last season to 52.8% this season. This year’s mark is good for second best in the entire NHL, and as such it has generated a certain amount of attention and respect from game analysts.
The question is: how much does winning face-offs really matter?
The short answer is: not nearly as much as what happens immediately after. Face-offs are just one of many types of puck battles that occur throughout the course of a hockey game, so it’s important to keep that in perspective. We’ll go through a number of issues that plague the traditional face-off percentage statistic, and look at metrics that do a better job of assessing real success in the face-off dot.
The Value of Face-offs
The value of a face-off seems like it should be fairly straightforward. It’s a puck battle that starts from a stationary position, and winning one theoretically means winning possession. The hockey analytics crowd has been harping on the importance of puck possession for well over a decade now, so you’d think they’d be on board with face-offs being of pivotal importance.
But you’d be wrong. Face-off percentage is, in fact, up there with plus-minus in terms of the degree to which hockey has traditionally overvalued the statistic.
As a refresher on the problems of plus-minus, it’s not the concept that’s flawed (attributing events to the players on the ice at the time), but the methodology (including empty net goals, not accounting for ratio and ignoring other contextual factors).
It’s the same thing with face-off percentage. The concept (winning possession) is fine, but the methodology is problematic. Face-off percentage is just too simplistic. Each face-off can have markedly different value depending on several factors like location and strength state, but these factors are ignored when using a single value percentage.
Face-off win percentage is riddled with issues, but I boiled it down to four main problems:
- Not all face-offs are equally difficult.
- Not all face-offs are equally important.
- Winning face-offs does not have the same value for all players.
- Face-offs are not necessary to establish possession, generate offence and score goals.
Now let’s through each problem individually.
1. Not All Face-offs Are Equally Difficult
Consider the fact that the NHL recently implemented new rules for face-offs that requiring the centre closest their own goalie to place his stick on the ice before the other centre, thereby giving the offensive centre an advantage on the draw. The data supports that offensive zone draws do come with a higher success rate than defensive zone draws (the two types of end zones draws of course have an inverse relationship to one another). So far this season, centres taking draws in the offensive zone are winning 51.1% of draws versus 48.9% for their defensive counterparts. As a result, a player that takes more offensive zone draws than defensive zone draws will have an artificially inflated face-off percentage that belies their true talent on the draw.
Then we should factor in who they’re taking the face-off against. It could be an ace like Claude Giroux or it could be an inept winger stepping in after a wave-out.
Furthermore, there’s handedness to consider, as many players fare better against either lefties or righties, with a relation not too dissimilar to pitchers and batters in baseball. Left-versus-left and right-versus-right logically has to come out at 50% (every face-off has one winner and one loser), but it appears that lefties have a slight advantage against righties, at least this season, according to the chart below.
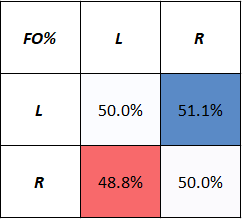
Considering these factors together, a right-handed centre taking a defensive zone draw against a left handed centre is at a notable disadvantage, and expectations of success should be tempered accordingly.
2. Not All Face-off Wins Are Equally Important
A face-off taken in the neutral zone does not have the same level of threat or importance as a face-off taken in an end zone. This should be self-evident. Zone starts (while somewhat overrated) are exploited for this exact reason. Coaches attempt to tip the scales by getting their best offensive players out for offensive zone draws, and the best defensive players out for defensive zone draws (or least to some extent depending on their interpretations of best offensive and defensive players).
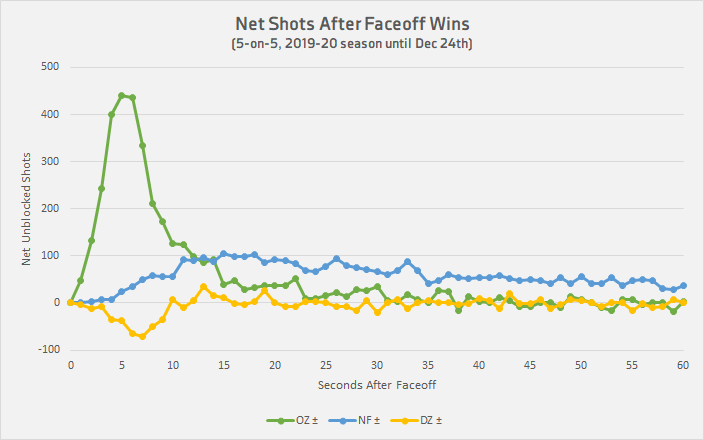
The benefits to offensive zone face-offs are confined almost entirely to the first 10-15 seconds following the face-off. The graph below (inspired by a similar one by Craig Tabita at Hockey Prospectus, updated for the present season) plots unblocked shots against seconds following a face-off win. Unsurprisingly, wins in the offensive zone lead to large increases in shots, while wins in the neutral zone lead to a modest increase and wins in the defensive zone actually lead to a slight net negative in shots (after all, even a defensive zone face-off win still leaves the winning team in the defensive zone).
Strength state should also be taken into consideration, but by and large the differences in strength state are direct results of face-off location. Power plays inherently involve more offensive zone face-offs (and penalty kills involve the inverse). Centres that are frequently deployed on the power play will reap the benefits of offensive zone draws and in turn the associated bump in face-off success rate.
The chief takeaway from this issue is that the location of the face-off yields a large amount of influence on the likelihood of winning that face-off.
3. Winning Face-offs Does Not Have the Same Value For All Players
A face-off won by Jay Beagle does not have the same value as a face-off won by J.T. Miller, even if both are taken in the offensive zone. Once again, this is intuitive. When Jay Beagle wins a face-off, he attempts to set up in the offensive zone with the likes of Tim Schaller and Tyler Motte. When J.T. Miller wins a face-off, Elias Pettersson and Brock Boeser are darting for scoring positions. The situations do not pose remotely similar levels of danger to the opposition.
To demonstrate this, we can analyze what happens in the immediate aftermath of a face-off. Tabita created Net Shots Post Face-Off (“NSPF“), a metric that measures net shots (shots for minus shots against) within 10 seconds of a face-off, then compares that to an expected value based on league averages. (Note: Tabita’s website, puckbase.com, appears to have some errors in its data for the last couple of seasons, so I have had to recreate the data myself using his method and using data pulled from PBP data at evolving-hockey.com)
This next table shows the top ten players in 5-on-5 NSPF to this point in the season (minimum 100 face-offs taken), without accounting for volume of face-offs taken. Philadelphia’s Claude Giroux is dominating in this regard, generating of his post-face-off value in both the offensive and defensive zones. Giroux has taken 138 offensive zone face-offs this season, with his team generating 41 unblocked shots within 10 seconds of the face-off and allowing just 2, for a net-shot value of +39. The expected shot generation here based on league average is 23.3, giving Giroux +15.7 adjusted net shots in the offensive zone alone.
| Player Name | NSPF | NSPF/FO | OZ Adj. FF± | NZ Adj. FF± | DZ Adj FF± | FO | OZ FO | NZ FO | DZ FO |
| CLAUDE GIROUX | 32.85 | 0.0747 | 15.66 | 1.00 | 16.19 | 440 | 138 | 108 | 194 |
| RYAN JOHANSEN | 24.13 | 0.0556 | 19.86 | 1.00 | 3.27 | 434 | 137 | 178 | 119 |
| SEBASTIAN AHO | 22.16 | 0.0564 | 17.36 | 2.00 | 2.80 | 393 | 128 | 137 | 128 |
| JONATHAN TOEWS | 20.91 | 0.0415 | 6.26 | 5.00 | 9.65 | 504 | 187 | 155 | 162 |
| SIDNEY CROSBY | 20.01 | 0.0744 | 11.72 | -2.00 | 10.29 | 269 | 102 | 95 | 72 |
| NICK BONINO | 19.77 | 0.0601 | 3.37 | 1.00 | 15.41 | 329 | 92 | 106 | 131 |
| BLAKE LIZOTTE | 18.30 | 0.0577 | 6.71 | 1.00 | 10.59 | 317 | 96 | 118 | 103 |
| CHRISTIAN DVORAK | 16.37 | 0.0498 | 11.67 | 3.00 | 1.70 | 329 | 120 | 105 | 104 |
| AUSTON MATTHEWS | 16.35 | 0.0430 | 4.07 | 4.00 | 8.28 | 380 | 135 | 132 | 113 |
| SEAN COUTURIER | 16.18 | 0.0498 | 10.56 | 1.00 | 4.62 | 325 | 97 | 107 | 121 |
For contrast, here are the ten worst in NSPF this year:
| Player Name | NSPF | NSPF/FO | OZ Adj. FF± | NZ Adj. FF± | DZ Adj FF± | FO | OZ FO | NZ FO | DZ FO |
| ERIC STAAL | -18.74 | -0.046 | -8.59 | 1.00 | -11.14 | 410 | 150 | 131 | 129 |
| MARCUS JOHANSSON | -18.63 | -0.071 | -12.35 | -2.00 | -4.28 | 261 | 84 | 108 | 69 |
| MIKA ZIBANEJAD | -18.62 | -0.065 | -6.86 | -1.00 | -10.77 | 288 | 93 | 111 | 84 |
| RADEK FAKSA | -18.38 | -0.051 | -14.03 | 2.00 | -6.35 | 358 | 123 | 131 | 104 |
| BRETT HOWDEN | -17.54 | -0.059 | -9.78 | 2.00 | -9.76 | 297 | 110 | 103 | 84 |
| CARL SODERBERG | -17.51 | -0.050 | -10.64 | -5.00 | -1.87 | 350 | 115 | 146 | 89 |
| JOHAN LARSSON | -16.77 | -0.064 | -14.04 | -3.00 | 0.27 | 261 | 88 | 95 | 78 |
| MARK SCHEIFELE | -14.86 | -0.031 | -8.99 | -2.00 | -3.88 | 484 | 164 | 178 | 142 |
| KEVIN HAYES | -14.60 | -0.038 | -5.11 | 0.00 | -9.49 | 381 | 118 | 142 | 121 |
| FRANS NIELSEN | -12.53 | -0.051 | -8.95 | -3.00 | -0.58 | 245 | 70 | 102 | 73 |
While we’re here, let’s look at the Canucks top face-off takers and see how they’re doing in this regard, this time sorted by NSPF/FO to control for volume of draws taken:
| Player Name | NSPF | NSPF/FO | OZ Adj. FF± | NZ Adj. FF± | DZ Adj FF± | FO | OZ FO | NZ FO | DZ FO |
| ELIAS PETTERSSON | 3.68 | 0.0354 | 0.75 | 1.00 | 1.94 | 104 | 25 | 50 | 29 |
| J.T. MILLER | 3.72 | 0.0130 | -0.42 | 0.00 | 4.14 | 286 | 120 | 83 | 83 |
| BO HORVAT | -8.77 | -0.0151 | -5.88 | 3.00 | -5.90 | 583 | 187 | 201 | 195 |
| JAY BEAGLE | -4.44 | -0.0202 | -3.37 | 4.00 | -5.08 | 220 | 55 | 83 | 82 |
| BRANDON SUTTER | -4.81 | -0.0305 | -3.32 | 3.00 | -4.49 | 158 | 43 | 59 | 56 |
| ADAM GAUDETTE | -8.15 | -0.0485 | -1.98 | -1.00 | -5.17 | 168 | 41 | 75 | 52 |
You’ll notice that Pettersson, who has frequently been relieved of face-off duty this season by linemate J.T. Miller, has actually been the best at turning face-offs into offence this season, though Miller is close behind (one could also make an argument that Travis Green’s meticulous control over when Pettersson actually takes face-offs has had a hand in these results; the testing of such an argument is beyond the scope of this article).
It’s worrisome though that the other four prominent Canucks centres are all losing ground on face-offs, particularly Adam Gaudette and Brandon Sutter, who are losing a ton of ground after face-offs despite pretty sheltered deployment.
4. Face-offs Wins Are Not Highly Correlated with Generating Offence
This is where things really fall apart for face-off percentage.
The fact of the matter is that face-offs are just a small subset of the dozens and dozens of battles that take place during a hockey game. It’s important to get possession, certainly, but tracking possession won by face-off while ignoring possession changes resulting from corner battles, takeaways, dump and changes and so on can be highly misleading. Suggesting that face-offs are significantly more important than other battles simply because they represent that start of play would be disingenuous.
It shouldn’t come as a large surprise then that face-off percentage is not highly correlated with shot metrics or goal scoring. NSPF, discussed in the previous section, shows a higher correlation with shares of shots-on-net, shot attempts, unblocked shots and expected goals than face-off winning percentage.
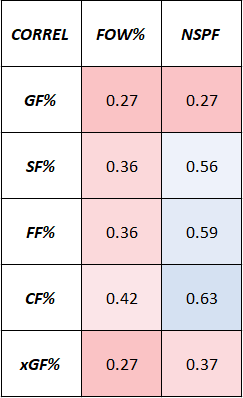
However, if we look at shift starts instead of merely face-offs, we get some interesting results: shifts that begin with offensive zone face-offs have higher shot shares on averages, while the reverse is true for shifts starting in the defensive zone.

It should be noted, however, that while this effect is present it is still muted by the face that offensive zone and defensive zone starts make up only about 20% of shifts starts, with neutral zone starts taking up another 20% and on-the-fly accounting for 60% of shift starts (which is why I’ve made the case previously that zone start percentages are overrated).
The differences in shots shares in the above table have nothing to do with winning face-offs however – just where they were taken. Face-offs that a taken in the defensive zone are the riskiest type of face-offs for the defending team, regardless of whether the face-off is won or lost.
As an anecdotal example, take Tyler Motte’s goal from Monday night: Motte took the face-off and, according to the official score sheet, lost; and yet within a matter of seconds, he scores a goal.
According to the official scoresheet, Edmonton wins possession of the puck on this play, but because of their location on the ice, they are still under threat, and Motte capitalizes. This is the type of play that would be ignored by face-off percentage, but captured by NSPF.
At this point you may be asking yourself, is there a recommended alternative to face-off percentage? Or is this guy just railing on a stat for no reason?
My suggestion is to avoid referencing face-off winning percentage as an important number and instead assess through Tabita’s NSPF, simply because it measures what we actually care (generating offence, which I’ll remind you in the point of hockey) about as it relates to face-offs, without getting overly tied up in the results of the face-offs themselves.
Application to the Canucks
As mentioned off the hop, the Canucks are one of the league leaders in face-off win percentage. But as we’ve established, face-off win percentage is a poor measure of success after face-offs. So let’s see how they’ve performed by NSPF instead.
As a team, the Canucks have a NSPF value of -16.68, meaning that they surrendered a net amount of nearly 17 unblocked shots within 10 seconds of face-offs compared to league average, which is the sixth worst in the NHL. This is somewhat surprising given how high their winning percentage is, but this reinforces the idea that there is more to having success off of face-offs than simply winning the draw.
The following chart plots face-off winning percentage against net shots post face-off for all NHL teams at 5-on-5. Vancouver’s position on the chart (in the bottom left quadrant and edging toward the bottom left corner) indicates that are doing a relatively poor job at converting face-off wins into offence.
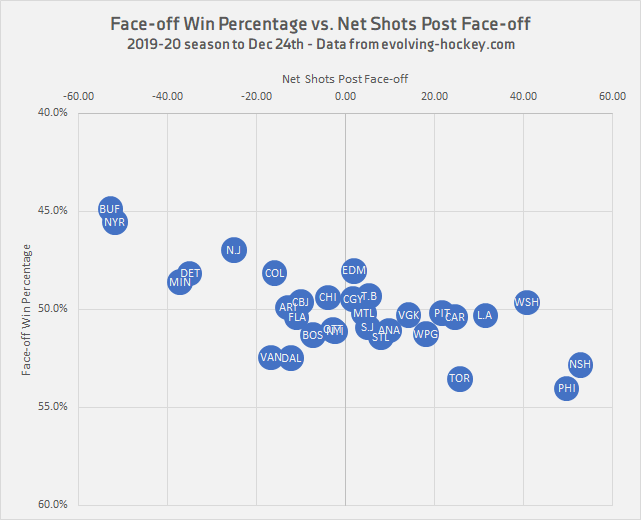
The Canucks have certainly improved their ability to win face-offs this season, but something in the aftermath isn’t working for them. As noted in the table of Canucks players above, this lost ground is coming from all centres besides the top line. A more in depth discussion on why that is the case is a good topic for future research.
The bottom line for today is that winning face-offs is preferable to losing them, but an all inclusive face-off percentage does an insufficient job at contributing to the big picture. What’s actually important is what happens after the face-off, regardless of whether it was “won” or “lost”.
Recent articles from Jeremy Davis

