Way, way outside the organizational philosophy

Eric Staal can’t decide who he likes best, Rick Nash or Corey Perry. We’re pretty sure the Canucks do.
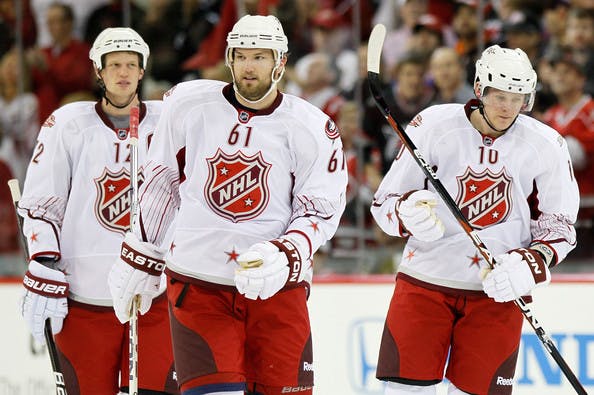
(Photo: Kevin C. Cox/Getty Images)
Twitter is…all..a-twitter…about Rick Nash being on the move. Coming after much recent speculation about Corey Perry, how can Canucks fans stand it all?
Some, like our very own Jeff Angus, are predicting the Canucks will make a major shakeup at the trade deadline. My own feeling is they need a defenceman but, what the heck, if there’s a high-quality scoring winger out there – even if the Canucks have already picked up the underappreciated David Booth – it’s worth considering.
Let’s take a look at the two names that have been batted about recently as possible targets for the Canucks: Rick Nash, as mentioned, and Corey Perry. Even disregarding who would have to move out the other way, let’s assess both players on the principle you acquire the player first and sort out the rest second.
The Canucks use a lot of metrics to value players, but let’s start with the the basic numbers:
| GP | G | A | +/- | TOI | PPG | SHG | PIM | Shots | Sh % | |
|---|---|---|---|---|---|---|---|---|---|---|
| Rick Nash | 57 | 18 | 21 | -22 | 19:25 | 4 | 0 | 28 | 219 | 8.2 |
| Corey Perry | 56 | 27 | 18 | -5 | 21:51 | 12 | 1 | 77 | 206 | 13.11 |
The 2:26 difference in ice time is straightforward: Perry gets about 40 secs more pre game in PK time, but more importantly, averages about 6 secs longer per shift. Lay that out over 24.8 shifts per game (Nash takes 24.7) and you get your difference in ice time. (Perry is averaging 53 secs per shift, a full 8 seconds more than the Sedins.)
Nash has been rather unlucky in his shooting percentage – his career number is 12.64% – but Perry is about bang on the money.
Both are known goal scorers who can bag your team 30-50 goals a year. That’s nothing to sniff at. But there are things around the edges will tell a far more useful story.
Let’s go deeper:
| Corsi Rel | Corsi On | On-ice Sh% | On-ice Sv% | PDO | EV TOI | ||
|---|---|---|---|---|---|---|---|
| Rick Nash | 1.6 | -0.07 | 7.16 | 90.2 | 974 | 15:27 | |
| Corey Perry | 13.0 | 3.86 | 8.1 | 90.1 | 982 | 16:50 | |
| Daniel Sedin | 22.9 | 21.15 | 9.6 | 93.3 | 1029 | 15:21 |
I included Daniel as a comparison point to show what happens when your team is shooting well and you get excellent goaltending. Of course, it’s also well documented here about how much protection the Canucks give the Sedins in their zone starts (Daniel’s at 79%) . This year, Perry is starting just 47% of his shifts in the offensive zone; Nash is at 54%. What’s interesting is that Daniel’s Corsi Rel has remained relatively constant through the years, even as his offensive zone protection has increased.
What we see is a few things – we can see how crap the Anaheim and Columbus goaltending has been, and how good the Canucks’ has been. Again we also see the impact of Perry’s extra long shifts – he’s got more EV ice time than his peers. Both Perry and Nash have been somewhat unlucky – Nash more than Perry in their team’s shooting percentages while they’ve been on the ice. This has driven their plus/minus downwards.
Nash’s Corsi numbers tell us a lot – when’s he’s on the ice, his team is just about break even on shot opportunities. When he’s not, they aren’t much worse off. Columbus plays an equal opportunity game, with lots of shots going both ways, but this is not unlike many teams in the NHL. The important thing to understand is this doesn’t change whether Nash is on the ice or not.
(One thing that should be acknowledged: they’re getting burned on their shooting percentage. A few goals here, a few goals there and they are no longer all alone in the NHL’s basement. At least they’d have the Oilers for company.)
On the other hand, Perry’s Corsi numbers are very much in line with his historical trend. When he and Ryan Getzlaf (and Bobby Ryan) are on the ice, the team does ok. When they’re off, it’s good night Anaheim. This is where we start to see the difference between the two, and where the Canucks’ evaluation of Rick Nash begins to turn sour.
Put these Corsi numbers in line with each player’s zone finishes – Perry is a 4.5% increase to 51.5%, Nash declines about 4% to 50.4% – and we can see who drives their team. The real story lies in just this; it’s clear Corey Perry has a massive influence on his team’s performance, while Rick Nash doesn’t. That’s not very good for the 5th highest paid player in the league.
So we come to the final assessment – salary. The Canucks have shown clear signs that they set price points on particular skill sets and roles. The Sedins, by all accounts, took less money to stay with the Canucks than they might’ve on the open market so that the Canucks could use a few extra bucks on keeping Alex Burrows and bringing in guys like Dan Hamhuis.
Corey Perry’s cap hit is $5.35 million a year; Nash’s is $7.8 million. Perry’s contract is up after next season; Nash is under contract until 2018. Nash turns 28 this year, Perry turns 27.
Bringing in Rick Nash would completely overturn the Canucks’ philosophy to date of not grossly overpaying for talent. Further his enormous contract would lock the team into a player far longer than they’ve (mostly) shown a willingness to. Bringing him in makes no sense. Corey Perry, on the other hand, does.
Rick Nash may be the highest salary available but he’s far from the best player available. The Canucks won’t be picking him up.
Recent articles from Patrick Johnston


