Microanalyzing Canucks faceoffs issues
By Cam Charron
10 years ago
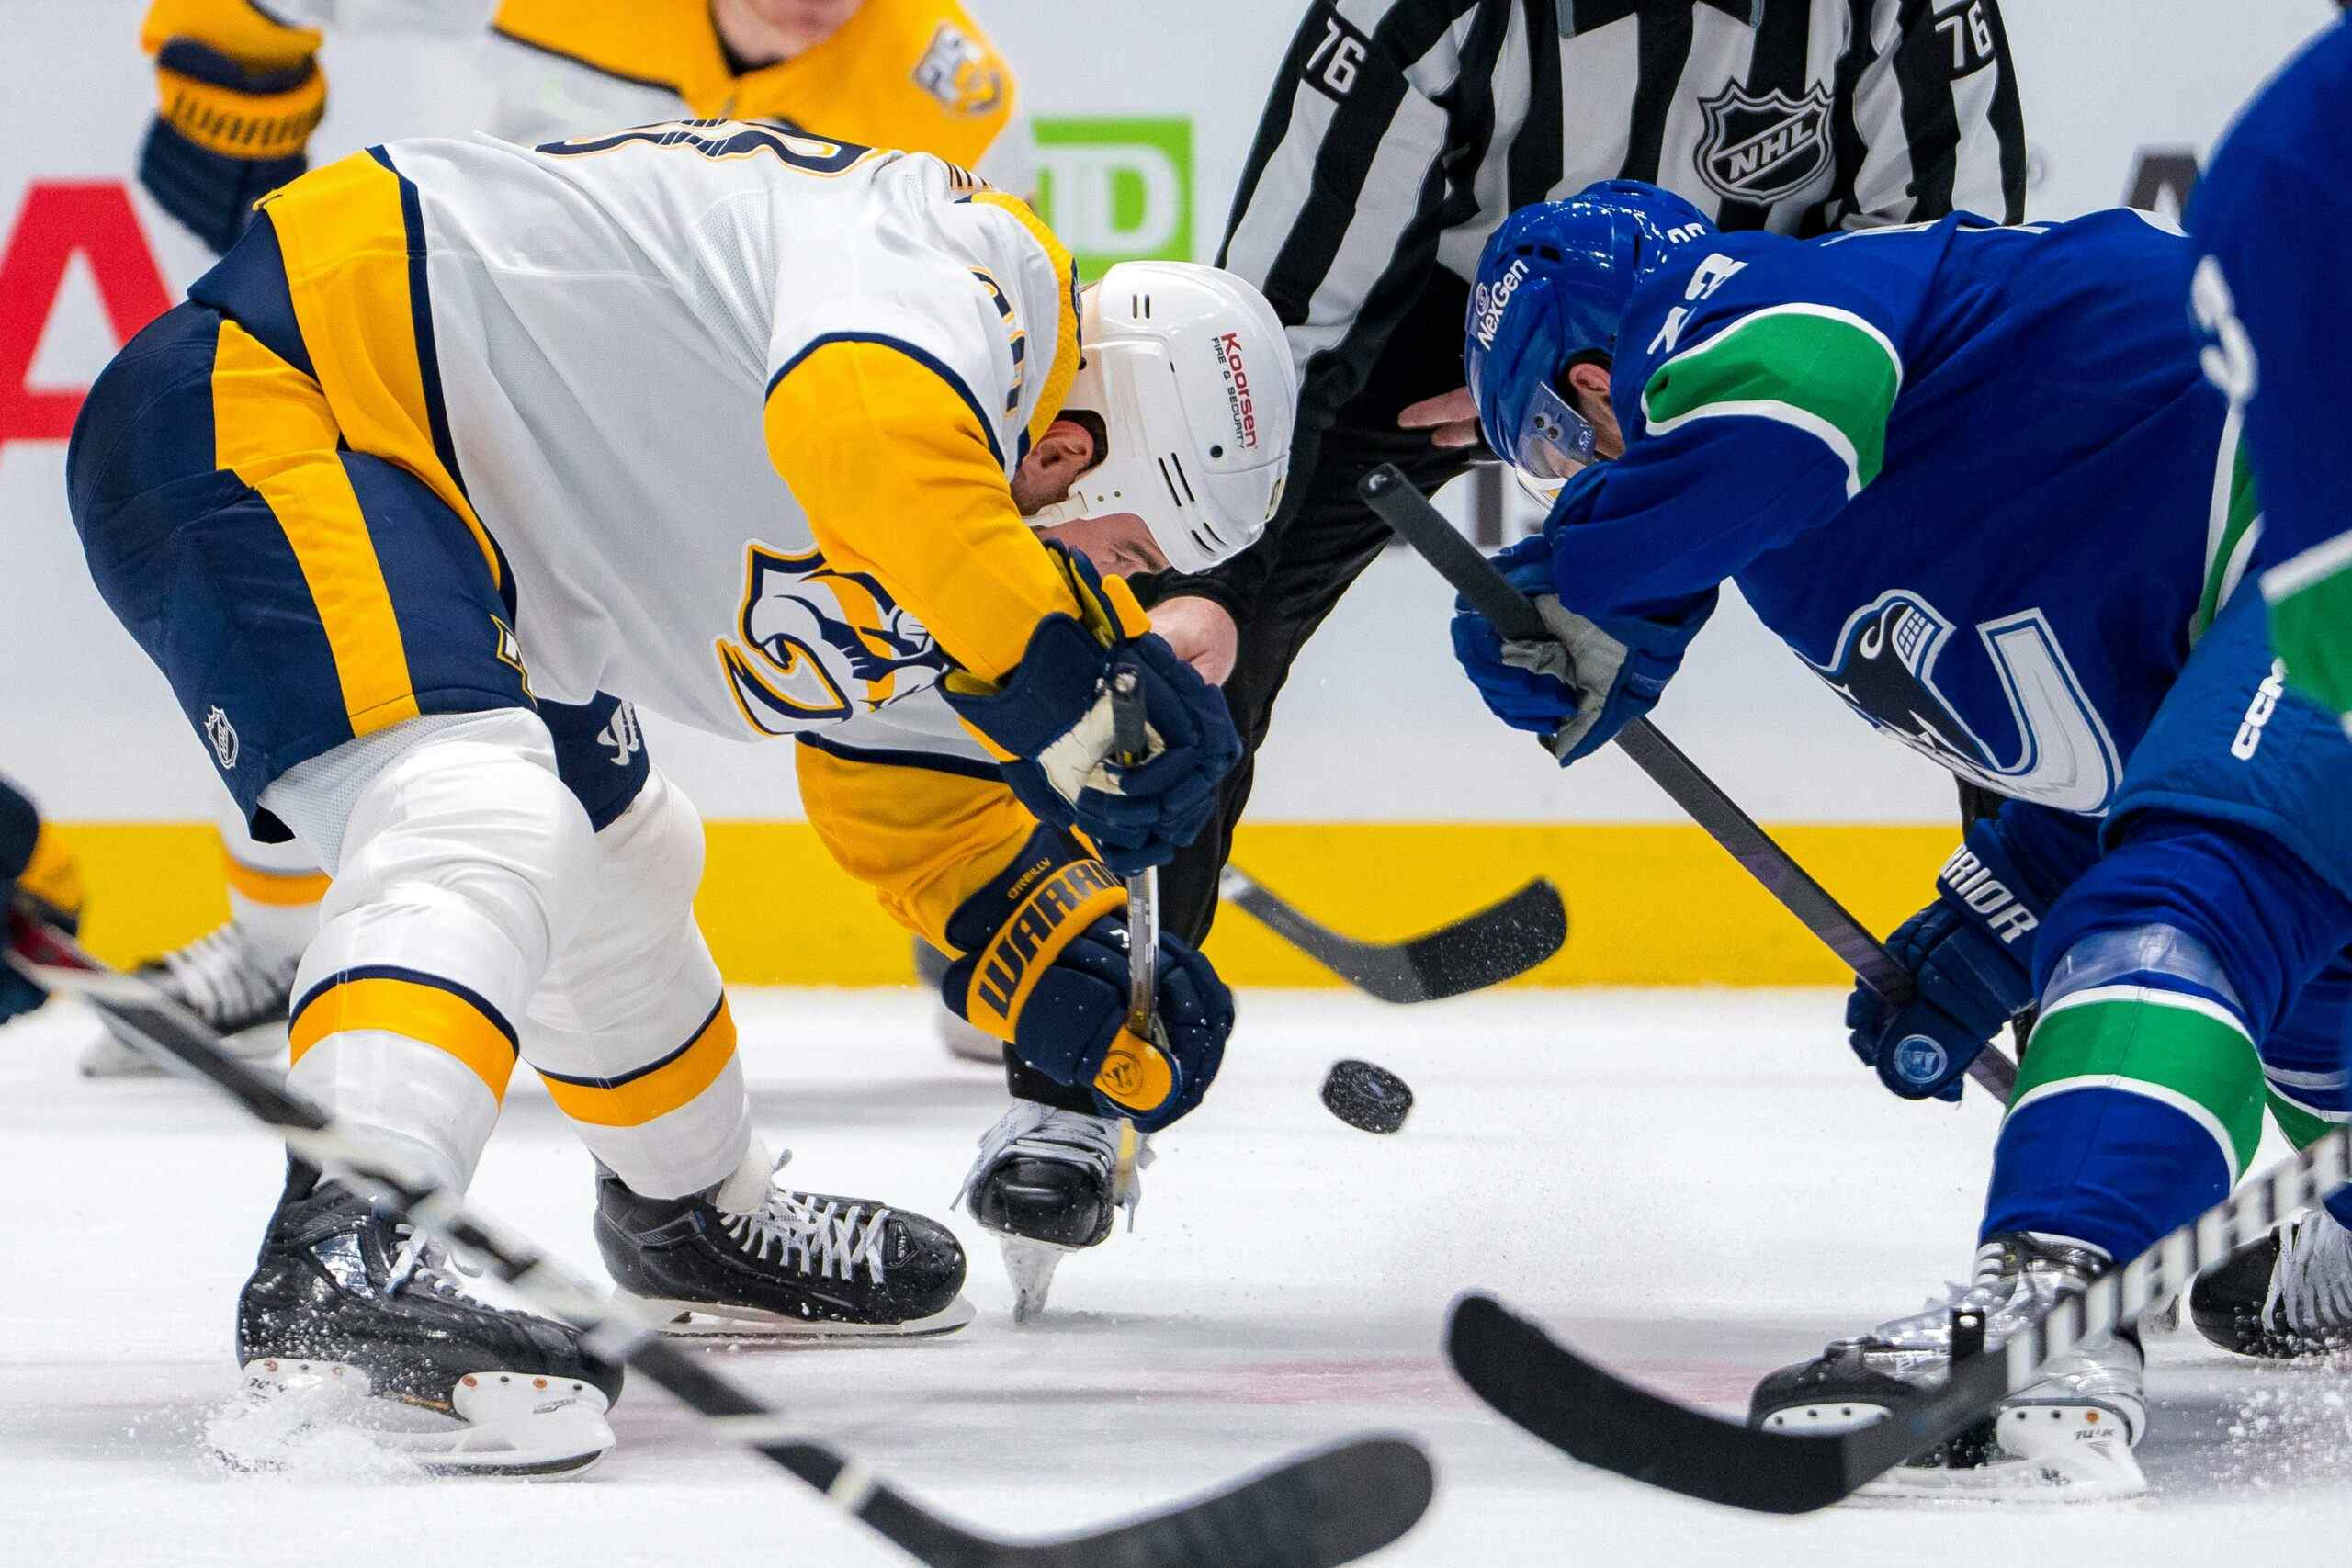
Quick observation on faceoffs based on Game 1. This seems to be the target for Vancouver Canucks observers and I don’t particularly get why. Any microanalysis on faceoffs I don’t like to trust. For one, the NHL is inconsistent in properly rewarding winners and losers of draws. For two, virtually anybody who looks at faceoffs on a macro-level usually finds inconclusive evidence that teams that are good at winning and losing draws help teams win a lot of games.
There’s some evidence to indicate that faceoffs have a hand in puck-possession, but it’s not the thing. Vancouver, New Jersey and Ottawa all seemed to do well at overall possession, calculated by shot differential statistics, this season without being particularly proficient on faceoffs. Boston, San Jose and Chicago are good at draws.
It’s a thing but it’s not the thing.
Look at the Sharks’ faceoff winning percentage. Now look at the Canucks’ faceoff winning percentage. Teams can win games without being stellar in the faceoff circle, but if this trend continues, the Canucks will have to work hard to take possession away from the Sharks after a faceoff…a lot.
Vigneault, meanwhile, was in a message-sending mood to the officials. The Canucks were whipped in the faceoff circle in Game 1 — winning just 30 of 70 draws — and he accused the Sharks of, well, bending the rules.“They cheat and they’re allowed to cheat,” stated the Canucks coach. “It makes it more challenging.”
Faceoffs were a noteworthy item going into this series, since the San Jose Sharks finished second in the league (53.4 per cent) in the regular season and the Vancouver Canucks were 25th (47.6 per cent), out of the 30 NHL teams.It popped up again after Game 1, with a 57 per cent (40-of-70) win percentage for the Sharks, helping them to the 3-1 decision.
All you young statistical analysts out there, listen up…
The way to do statistical analysis isn’t to look at the Event Summary after a game, and if the team lost, find the column they were the worst in and say that’s why the reason they lost. Sometimes the better team loses. I don’t think that happened on Wednesday night, but it was an even game determined by a couple of coin flip goals in the third period. One bad shift and one bad bounce.
Here are the Canucks’ faceoffs broken down by period:
| Period | FO W | FO L | FO% |
| 1st | 11 | 13 | 45.8% |
| 2nd: | 9 | 14 | 39.1% |
| 3rd: | 10 | 13 | 43.9% |
| Game: | 30 | 40 | 42.9% |
| Period | VAN | SJS | FO% |
| 1st | 1 | 5 | 45.8% |
| 2nd: | 7 | 4 | 39.1% |
| 3rd: | 0 | 2 | 43.9% |
Note that the Canucks’ best period in scoring-chances was their worst period in faceoffs, and the period they gave up the most chances was the one they won the most faceoffs.
It’s pretty tough to conclude that faceoffs are anything more than a passing concern. The Canucks dominated puck-possession in Game 1 of the series. They took the majority of the shots and attempts. The problem was that they didn’t turn their possession into scoring chances, and that’s not something fixed by faceoffs.
It’s not just Vancouver. Faceoff statistics are dissected everywhere. They’re easy to count and have a hand in the game, but they’re not the thing and they’re certainly talked about more than they deserve given their limited meaning on puck-possession and even more limited meaning on the winner or loser of the game.
Recent articles from Cam Charron

