Jay Beagle Isn’t Likely to Bring Washington Penalty Killing Prowess to Vancouver

By Jeremy Davis
5 years agoThe Canucks made something of a splash on July 1st when they handed out 7.9 million dollars in average annual value (and 27.6 million dollars in total contract value) to the likes of Jay Beagle, Antoine Roussel, and Tim Schaller. Each of these players, in a vacuum, make fine additions. For two of them (Roussel and Schaller), I can rationalize the cap value, and for one (Schaller), I can get behind the term.
The Jay Beagle contract, however, is much tougher to swallow. He seems to be a great guy, and there are enough backers of his leadership abilities that I’m willing to buy into that, but I don’t see enough on-ice value to justify a multi-year contract at his age (he’ll be 33 at training camp), let alone one worth $12-million over four years.
One justification that has been put out there is the fact that Beagle kills penalties. A lot. The Canucks have generally been quite bad at killing penalties over the last few years, and the Washington Capitals, Beagle’s former squad, have been quite good. For a lot of people, this is enough to assume that Beagle is a catalyst for a good penalty kill. To me, this is frighteningly simplistic and lacks critical thinking, but there seems to be a persistent perception that there is a direct connection between getting a lot of penalty kill time and being good at it, especially if a good team is affording that time.
Over the last half decade, the Capitals have been a very good team, and accordingly they have had a very good penalty (you don’t often see teams win Presidents Trophies, as Washington did in 2015-16 and 2016-17, without some very good special teams). The Canucks have been the inverse, as their poor special teams have sunk them on so many nights. It is interesting however, that it has only been four seasons since Vancouver’s kill was markedly better than Washington’s.
| Washington | Vancouver | |||
| Rate | Rank | Rate | Rank | |
| 2018 | 80.3 | 15 | 78.3 | 21 |
| 2017 | 83.8 | 7 | 76.7 | 28 |
| 2016 | 85.2 | 2 | 81.1 | 17 |
| 2015 | 81.2 | 14 | 85.7 | 2 |
| 2014 | 82.0 | 16 | 83.2 | 9 |
It’s also interesting that Washington’s PK took a substantial dip last season, with a kill rate in the middle of the league, and not that far above the Canucks as a matter of fact. As it happens, last season was also Jay Beagle’s worst unblocked shot rate of the past three seasons, coinciding with Washington’s faltering penalty kill rate. Whether he was a perpetrator or a victim of the Capitals’ diminishing kill rate is a matter of debate, but either way, it doesn’t exactly bode well. This is the first dent in the theory that Jay Beagle will bring penalty kill prowess with him, but there are many more to go.
Let’s move on to what is supposed to be his penalty killing calling card.
Faceoffs
Beyond the fact that Beagle has put in a lot of shorthanded minutes over the last several years, another purported feather in Beagle’s penalty killing cap is his strength in the faceoff dot. There are a lot of numbers out there in hockey analytics that can wash out to some extent with a number of confounding variables. Like shot metrics, faceoff numbers can be affected by quality of competition (who the draws are taken against) and zone starts, but the effect is comparatively minimal, and faceoff numbers are highly consistent. Consequently, when a player has a good faceoff percentage, we can usually safely assume that he is good at faceoffs. Beagle is undeniably good on the draw.
That said, being good at winning faceoffs does not automatically guarantee effectiveness in the aftermath. Much like there is very little correlation between winning faceoffs and shot shares (or puck possession), there isn’t much correlation between winning faceoffs and suppressing shots on the penalty kill. The underlying reasons are the same for each: the effects of a faceoff evaporate completely within 10-20 seconds.
Now, when it comes to killing penalties, I’d wager that there’s a higher degree of cost and benefit associated with faceoffs because of the ability to ice the puck. Even then though, within about 20 seconds, the opponent is attacking the blueline again, making the overall effect of the faceoff win valuable, but only to a certain extent. If a player can win a lot of faceoffs but struggles at the other aspects of penalty killing (eg, forechecking, zone entry defence, formation break ups), then their overall contribution to the PK may still be a net negative.
In order to assess the relationship between faceoffs and penalty kill suppression, I pitted 4-on-5 faceoff percentage against 4-on-5 unblocked shots against per hour for all players that spent at least 25 minutes at 4-on-5 last season and took at least 25 faceoffs in that situation. (Some people would prefer to look at goals against rather than a shot metric – I firmly believe this would be a mistake. For one, goals are a smaller sample than shots, which invites more volatility when considering rates; goals are also effected significantly by the quality of the goaltender, while shots given up are more indicative of the players defending on the ice. But, if it makes you feel any better, Beagle’s goals against per hour was also below average, and his expected goals against per hour was one of the worst on the Capitals last season.)
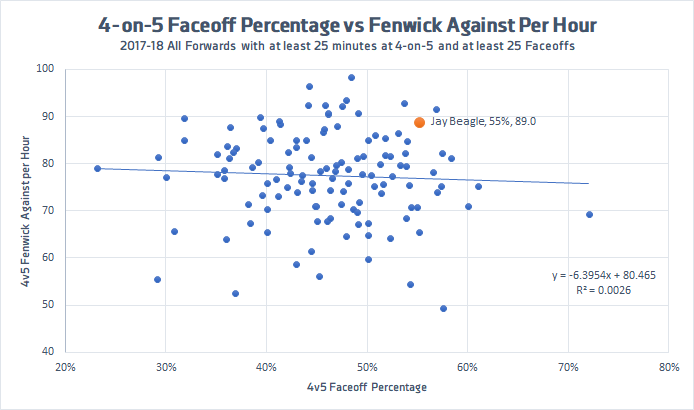
Data via Corsica.hockey.
So what does this chart show? First, the trendline shows that there is a relationship between winning faceoffs and suppressing shots at 4-on-5 (unblocked shot rates decrease on average when faceoff percentage increases), but it’s a very small relationship. The R² value of 0.0026 indicates quite a bit of variability along the trendline and a poor goodness of fit; in other words, while the averages show a slight relationship, there’s very little consistency on a player-by-player basis.
If you think about it logically, it makes sense. On average, teams take 1.68 defensive zone faceoffs for every two minutes at 4-on-5 (usually with a minimum of one, since almost all penalty kills start with a faceoff). That’s really a chance and a half per kill to win a faceoff on each kill. Even if the player had one of the league’s best percentages and one two-thirds of their draws on the kill, that’s about one win per kill, assuming they take all the draws (which they wouldn’t). Each of those wins leaves a large, but not perfect, likelihood of a zone clear (depending on how clean the win is, and the effectiveness of the teammate the next touches the puck), which would then lead to 15 to 20 seconds that the opponent then has to waste on regrouping.
A faceoff win on the kill is clearly a good thing, and I’d want to have a player who’s strong on the draw rather than weak when it comes to high leverage faceoffs. But they clearly make up only a small component of the overall penalty kill, and the player can easily still be a liability even with a high faceoff winning percentage, as even after a faceoff win, they still have to spend the rest of the time defending powerplays on the move.
Overall, the ability to win faceoffs has only a small effect on shorthanded shot suppression. So what does have a strong effect on shorthanded numbers?
Team Effects: Systems and Teammates
Two things you might often hear about penalty killing are that success therein is usually based on systems, and on teammates. I believe both of these things to be true.
Looking over the last four seasons, I plotted the unblocked shot against rates of players in consecutive years (year 1 on the x-axis and year 2 on the y-axis), separating the players that stayed on the same team (the left chart) from the players that changed teams from one year to the next (on the right), again with a minimum of 25 minutes at 4-on-5.
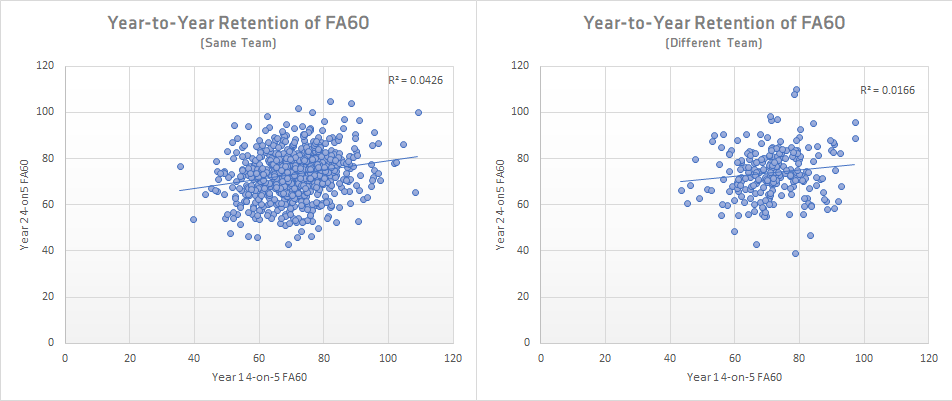
Data via Corsica.hockey.
The first thing that I found is that the slope for both was positive, and roughly identical. This indicates that powerplay shot rates have been rising steadily over the past few seasons, which isn’t really news. What’s more interesting is the correlations and goodness of fit between the first and second years of the data sets.
| Correlation | R-squared | |
| Same Team | 0.206 | 0.043 |
| Different Team | 0.129 | 0.017 |
For one thing, neither of the correlations are particularly strong, but players that stayed on the same team certainly had a higher correlation from one year to the next than players who moved from one team to another. The R² difference is just as significant. Both indicate that players that stay on the same team retain their unblocked shot rates better than players that move. To me, this provides further evidence that team effects (linemates and systems) play a noticeable role in the success of individual players.
This is terrible news for Jay Beagle, who, as mentioned, is moving from a good penalty killing team to a bad one. One possibility is that he brings improvement with him from the Capitals. But the much more likely possibility, as I see it, is the Canucks making a bad penalty killer out of Jay Beagle. They have, after all, spent the last couple of years making all of their penalty killers look pretty awful.
This will be a noticeable change for Beagle, as some digging reveals that the Washington Capitals were in fact making him look like a better penalty killer than he was, at least last season. Using data from the Line Tool at Natural Stat Trick, I put together this With-or-Without-You chart for Beagle’s unblocked shots against per hour rates with and without his most frequent teammates.
It’s not a flattering picture.
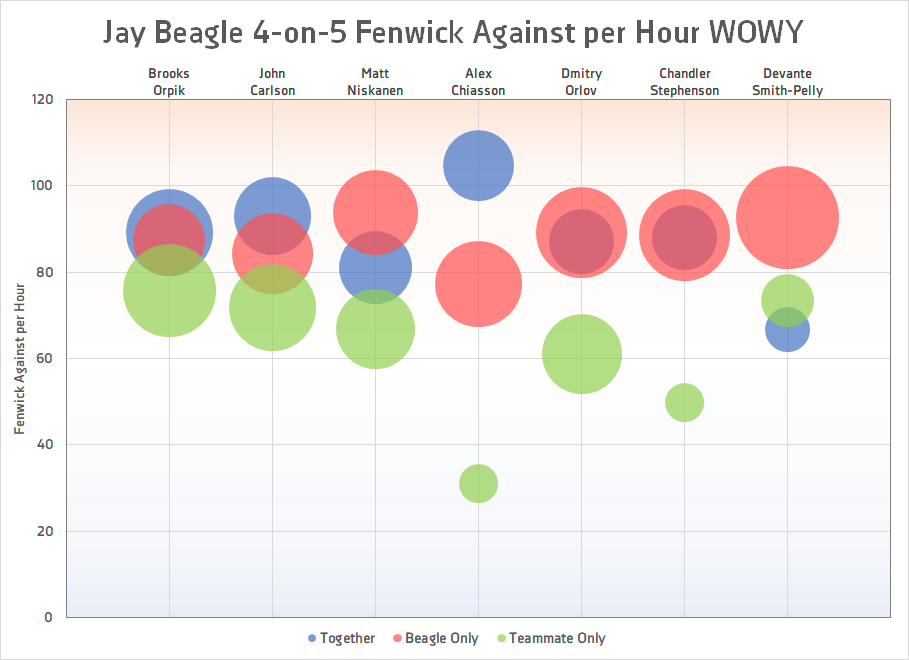
The red bubbles indicate Beagle’s rates without the above-noted teammates, while the green bubbles indicate teammates’ rates without Beagle, and the blue bubbles represent their rates together. These seven players represent all Capitals that spent at least 30 minutes with Beagle at 4-on-5 last year. In each and every case, the teammate showed reduced rates of unblocked-shots against when they weren’t on the ice with Beagle, sometimes by substantial margins.
Conclusion
The Canucks clearly paid a premium for Beagle’s off-ice intangibles. There’s little doubt that he would have garnered less interest from the Canucks and others if he hadn’t just won the Stanley Cup, and subsequently gotten praise from his teammates for his role in that run. It would be silly to argue that Beagle’s leadership and attitude won’t have a positive effect on the Canucks’ locker room and the young players therein.
That said, at 3.0 million dollars per season, he’s going to see some decent ice time (probably in the 12 minute range that he saw with Washington last year), and therein lies the issue. Beagle has been a substantial drag at even strength (both in terms of production and possession), and his penalty killing has now fallen off as well. His faceoff prowess is legitimate, but the ability of shorthanded faceoff wins to deter powerplay opportunities is very easy to overstate. Based off this and the above, it’s highly unlikely that Beagle brings any of Washington’s penalty killing acumen with him to the Canucks. Turning 33 later this calendar year, the standard age curve of professional athletes is working against him – it’s highly unlikely that he improves in 2018-19, and he’ll have three more years to go after that.
Recent articles from Jeremy Davis