Iain MacIntyre Talks Analytics; I’m Confused?

By J.D. Burke
7 years agoThe Canucks don’t have a lot going for them. This much is evident. They’re the league’s most impotent offence, and they haven’t been particularly stout in the defensive zone either.
By raw, goal-based metrics, the Canucks are arguably the league’s worst team. They’re scoring 1.9 goals per game, good for 30th in the league. In spite of out this world goaltending, they’re surrendering 2.9 goals per game, too, good for 21st. You don’t have to dig deep for evidence of this team’s shortcomings.
I wouldn’t dispatch of that spade just yet, though. According to The Vancouver Sun’s Iain MacIntyre, there are metrics which reflect a Canucks team that’s played well of late… I think?
Not all the numbers are bad for the Canucks.When they outshot the Detroit Red Wings 37-27 in Thursday’s 3-1 loss, it was the fourth time in six games on their 1-5 road trip that the Canucks outshot their opponents. And while their average of 28.1 shots per game was tied for 26th in the NHL, their new checking system is allowing only 28.5 shots per game, so Vancouver is a .500 team in terms of puck possession
Continued…
Unfortunately, despite the religious zeal of the analytics community, the NHL stubbornly refuses to award points in the standings for Corsi victories.Even in 2016, you must score more goals than opponents to win. To be in the fight for a playoff spot in April, the Canucks will need at least 40 actual (or shootout) wins. So far they have five.
Well, that’s something. Zing.
The thing to remember is that the trailing team will generally generate shots and shot attempts at a better rate than their opponent. This phenomenon is known to many as score effects. The implications of playing from behind and how that opens one’s offence are widely accepted by traditional and analytic minds alike.
The persistent tendency for teams who are leading to cede possession to teams who are trailing. This effect tends to accelerate the higher the goal differential in a game. For example, a team leading by three goals tends to give up more possession than a team leading by one or two goals (and vice versa). Can “wash out” over time, but can be very pronounced in small samples, such as a single game or a brief series of games. Corrected for by using corsi/fenwick close or tied (see above for definitions).
What we think we see is hockey’s version of the “prevent” defense, where you let a team bite off huge chunks of yardage to avoid the one big play. But it’s different than that.What’s strange is, score effects don’t really come from a change in tactical play as it does in soccer. I’d be willing to bet that Paul Maurice didn’t walk into the Winnipeg Jets dressing room before the third period and say “Okay, this period we’re switching from 2-1-2 to a more passive 1-2-2 and I’d like you to stop pressing offensively.”Instead, score effects seem to be derived from a number of minor influences.
Bourne then goes on to list luck, psychology and coaching tendencies slanted towards “safe” players as confounding factors.
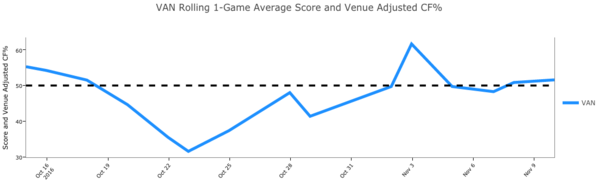
The Canucks have trailed their opposition for 423 minutes, according to Corsica.Hockey. That’s more than a hundred minutes higher than the next worst team, the Winnipeg Jets. That goes a long way towards explaining the Canucks 50% raw Corsi For%, counter their 47.3% score and venue adjusted Corsi For%.
In the five games MacIntyre’s referencing, the Canucks held a lead for exactly 5:20. Here’s their score and venue adjusted Corsi For% on a per-game basis over the course of the season. They were a better territorial team in two of the losses MacIntyre is alluding to.
And while I’d hardly fault MacIntyre for using the term “puck possession” to reference shot share, it’s worth noting that the “analytics community” is moving away from that terminology. Firstly, that’s not what Corsi For% and any of its derivatives measure. They’ve been shown to share a close relationship with puck possession, yes. What we’ve found over time, though, is that Corsi is a better indicator of future success than pure puck possession.
Which bites at the heart of MacIntyre’s commentary on Corsi victories, or whatever he’s trying to say. Nobody in the “analytics community” believes that a won shot clock, or shot attempt clock, can secure the winning team a victory. Not on a game-to-game basis. The reason we lean on Corsi is its predictive value. It’s proven itself a better indicator of future success than goal-differential, scoring chances or even wins.
Even if the Canucks were the better team by territorial metrics — which they haven’t been with any consistency — then that would indicate they’re playing well, and that due process will reflect itself in later results. Think of it at its most base level. Would you rather your team outshoot your opponents most nights? Since goals are the result of shots, I would think yes.
To that exact end, I’m puzzled by MacIntyre’s math, even at a base, unadjusted level. He cites the Canucks all-state shot share as break even — they surrender 28.5 shots per game, and shoot 28.1 themselves. It’s not a canyon-sized gap, but that’s the difference of about half a percentage point from “.500”.
Over the course of a season, that would put the Canucks at about 49.5% Corsi For. Only three of the twelve teams at or below that mark made the post-season. Of those three teams, two were the league leaders in PDO at 102+, which suggests they were extremely lucky, too. Fifteen of the eighteen teams above that mark made the playoffs. It’s a bigger difference than MacIntyre gives credit.
I’m not entirely sure what MacIntyre’s striking at. Is he stating that the Canucks are good in spite of their recent results? Is he trying to dig at the analytics community because the Canucks are losing when their underlying numbers suggest they’ve been at their best? Or better still, is MacIntyre, in the year 2016, using this anecdotal six game sample to prove just how useless analytics are?
He misses the mark on all fronts, and just sounds woefully out of touch. Worst of all, this isn’t the first, nor will it be the last, of his shots at the “analytics community” such as they are. He made one in the middle of last season and if memory serves took another shot in the summer.
One might reasonably expect a beat writer to do their research before taking such an ill-advised and otherwise pointless jab at something he doesn’t quite understand. It’s not like he doesn’t have the time. His job is to cover hockey, after all.
Recent articles from J.D. Burke