How did NHLers that shot 8% in 2011 do in 2012?

By Cam Charron
11 years ago
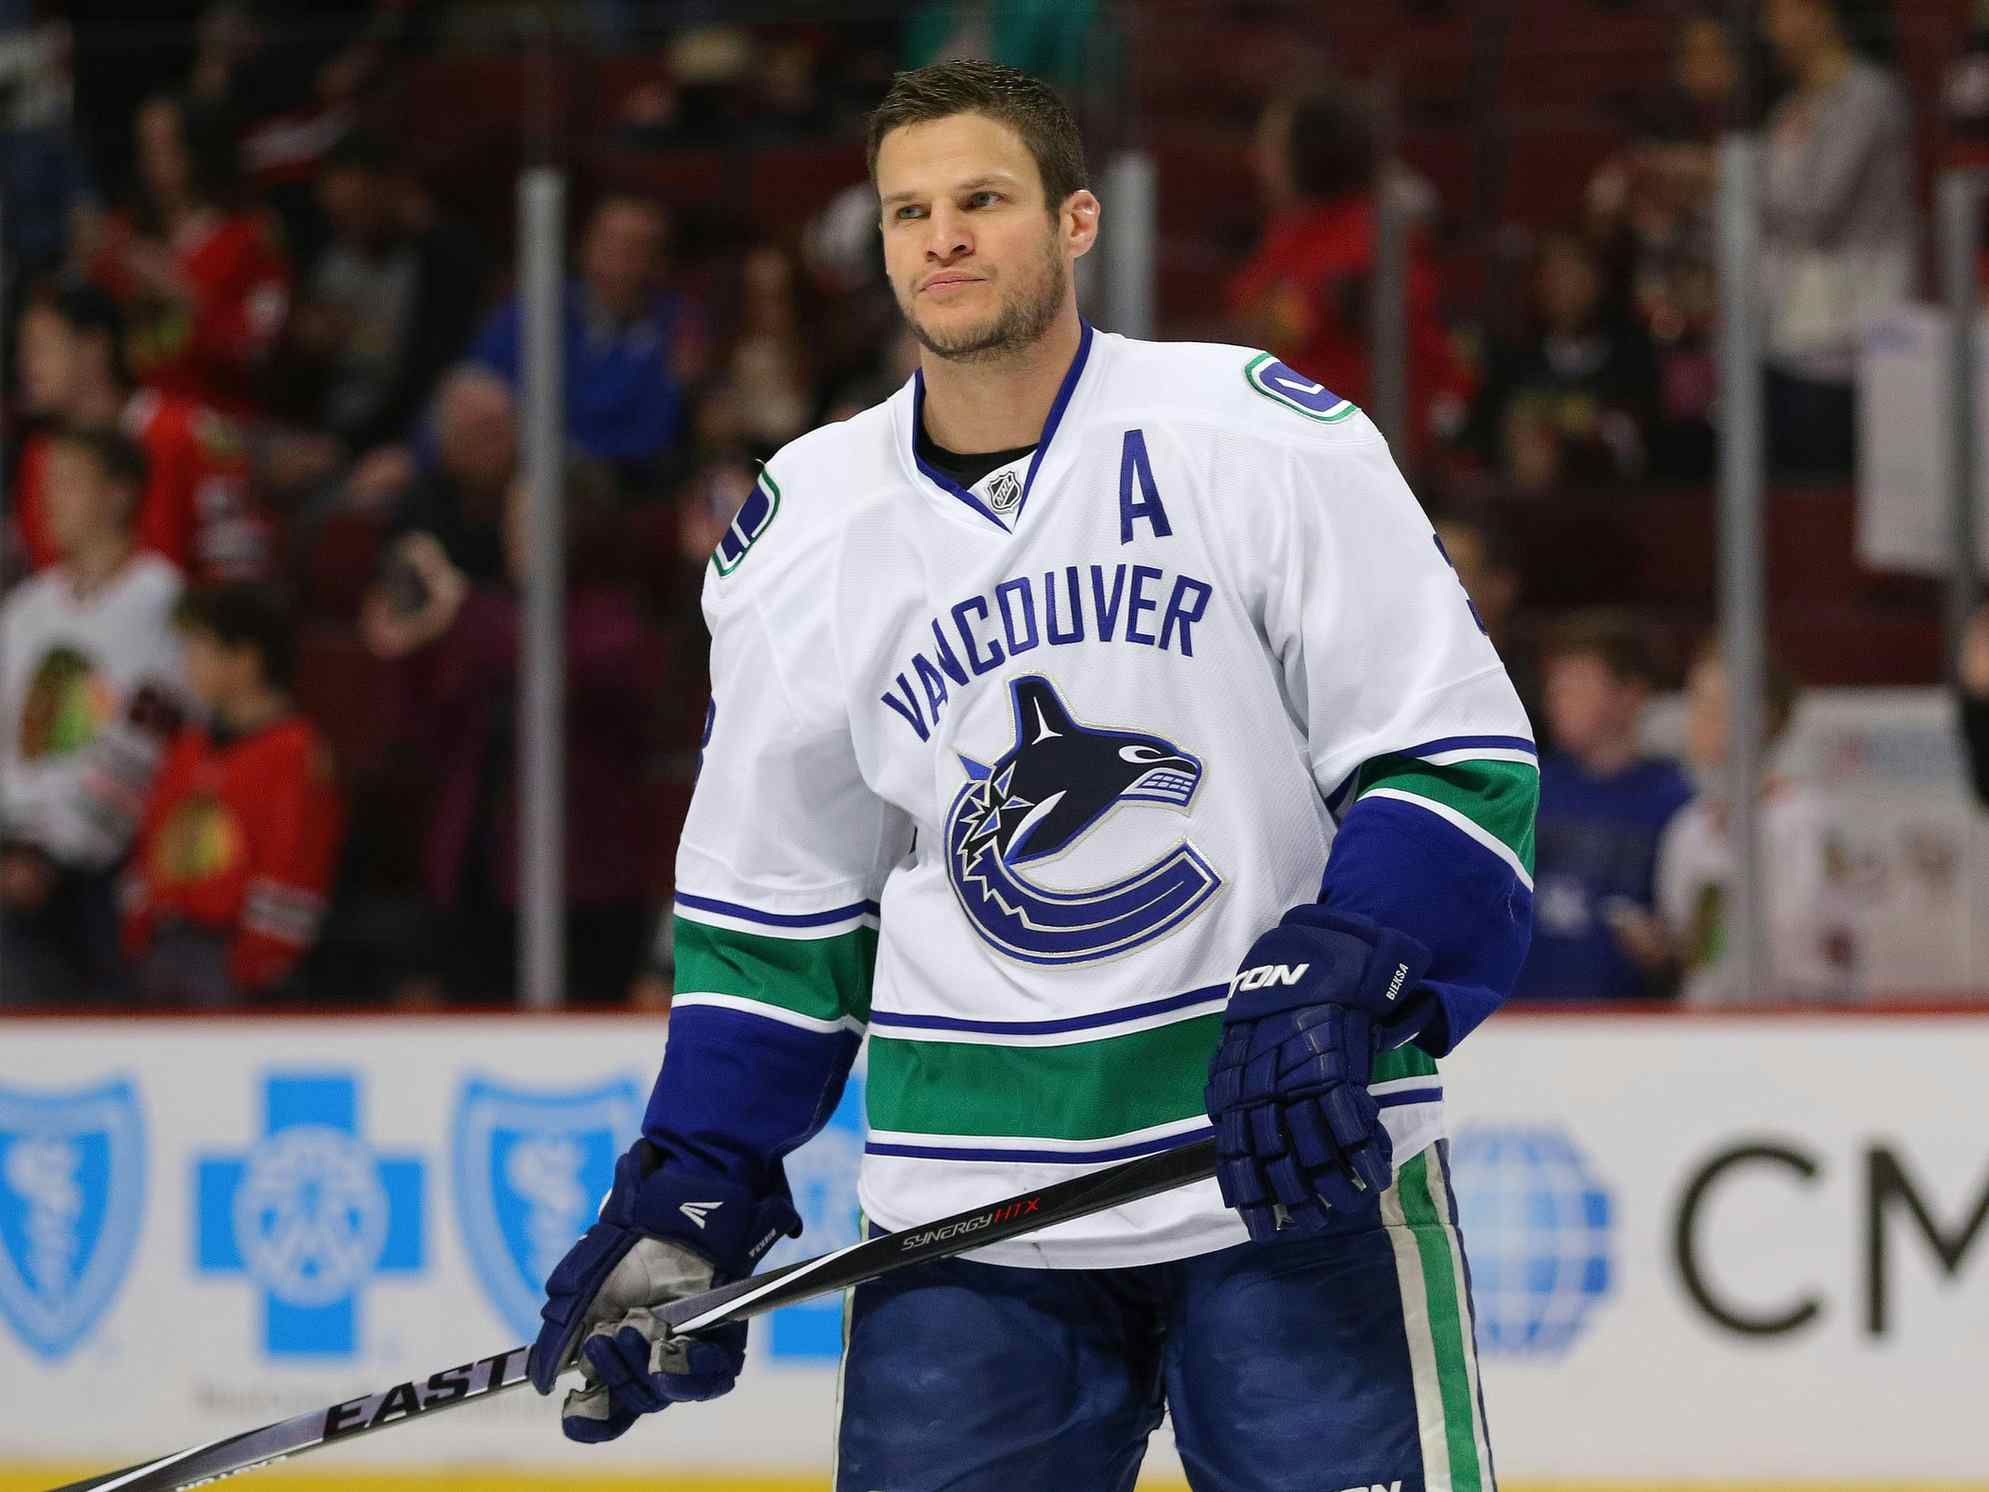
Mason Raymond in his natural habitat.
So Mason Raymond re-signed today, and a fanbase went nuts. But you all know the story. Thom linked to it earlier.
Anyway, I don’t think that fans in the Vancouver market truly appreciate shooter regression. Raymond shot at just 8% last season and 7.6% the season before that. Now, there’s reason to believe that “Raymond is just a horrible shooter” but like I showed with my Jason Garrison analysis, even four years doesn’t generally predict how good of a shooter a player is.
So I took the simple route. I looked at five forwards who had a shooting percentage similar to Raymond’s last year from the year 2011. I wanted to compare it with how they did in 2012. Small sample, whatever. Raymond is a small sample himself, and all we want is a general idea of what we can expect out of Raymond.
- Radim Vrbata
- Patric Hornqvist
- Matt Hendricks
- Jannik Hansen
- Matt Cullen
How did those players do in 2011?
| Goals/82 | Shots/Game | Sh% | |
|---|---|---|---|
| Vrbata | 19.7 | 3.04 | 7.92% |
| Hornqvist | 21.8 | 3.35 | 7.92% |
| Hendricks | 9.6 | 1.47 | 7.96% |
| Hansen | 9.0 | 1.38 | 7.96% |
| Cullen | 12.6 | 1.92 | 8.00% |
| All | 14.5 | 2.23 | 7.95% |
So, not too different from Mason Raymond. As a trivial exercise, Raymond had 14.9 goals per 82 games, 2.27 shots per game and a shooting percentage of exactly 8.0%. So he’s pretty much identical to these combined players.
How did those players do the very next season?
| Goals/82 | Shots/Game | Sh% | |
|---|---|---|---|
| Vrbata | 37.3 | 3.01 | 15.09% |
| Hornqvist | 29.1 | 3.03 | 11.74% |
| Hendricks | 4.2 | 1.24 | 4.12% |
| Hansen | 16.0 | 1.67 | 11.68% |
| Cullen | 15.7 | 2.25 | 8.54% |
| All | 20.4 | 2.23 | 11.16% |
Funny. Shots per game was exactly equal, yet the player’s scored more goals. Why? Because they got a couple more bounces apiece. Vrbata and Hornqvist each had career years. Hansen developed into a strong two-way threat. Even with Hendricks’ offensive meltdown, every other player increased their production.
For the record, Mason Raymond is not as bad as Matt Hendricks.
Recent articles from Cam Charron