


Travis Green is in town for mid-summer coaching meetings and putting increasingly more thought into what his lineup may look like as the season approaches. Since it’s the middle of summer with a lack of news to report, we can have fun with that same exercise.
There has already been a lot of speculation about what lineups we are most likely to see, but what lineup would result in the most wins? To assist us in trying to answer this, we are going to build a lineup using Sean Tierney’s WAR (Wins Above Replacement) Lineup Creator. Hockey fans continue to become more familiar with Sean’s work developing helpful data visualizations and tools like this one that can help fans gain a better analytical perspective on the components that lead to wins. In this piece, we will use more of his work to learn what Canucks lineup would earn the most points based on WAR.
The WAR Lineup Creator allows users to plug in an active player on any line to create a custom lineup. The lineup could be one that you think the Canucks may roll out, should roll out, or even a complete all-star squad, which makes it one of the most fun tools out there. Once you have filled in all of the players in the lineup, the tool also produces an approximate point total for that team. Before reading on, if you’re able to, open the WAR Lineup Creator to have a look and play around yourself. That will give you a better idea of what we are about to dive into.
In addition to having the player flexibility, users also have the ability to tinker with TOI for each line or pair in rows 29-32 on the Google Sheet. Keep in mind that TOI is represented as the total amount for the year (82 games) and the tool assumes all players will play 82 games. Obviously, the likelihood that will actually happen is virtually impossible, but it’s the middle of the summer, so what better time to engage in some idle speculation?
We have tried to keep it somewhat realistic by only having players slotted in where they have played in the past and have used Sean’s default TOI numbers, again, seen in rows 29-32. With that being said, let’s go ahead and create the lineup that results in the most points according to Sean’s tool.
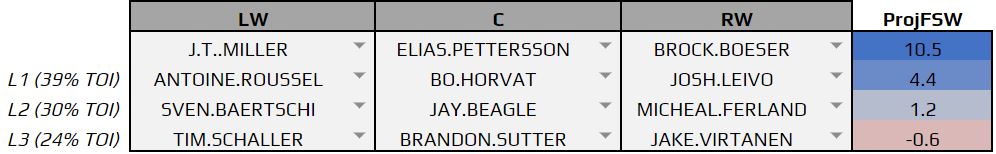
The forward lineup above results in the highest possible projected full-season WAR (ProjFSW) according to the tool, which uses Evolving-Wild’s data.
The top line is by far the best for the Canucks and actually quite good league-wide. The line is carried by Pettersson, who was able to put up a team-leading 0.131 WAR/60 last year. Miller also boasted a great WAR/60 of 0.125, while Boeser posted a 0.073. For some context, Sean has the Leaf lines of Johnsson-Matthews-Nylander and Hyman-Tavares-Marner putting up 5.8 and 6.3 ProjFSW respectively.
It’s a crowded forward group in Vancouver considering Goldobin, Pearson, Motte and Eriksson (let’s not get into it) did not make the cut. You will notice that the EvolvingWild WAR model likes Roussel, Leivo and Schaller maybe more than one would expect, while not showing as much love to Ferland, Gaudette and Goldobin one might think.
Realistically we could see Green swapping Beagle and Sutter or giving some of their minutes to Gaudette. A break-out season from Gaudette would really help the ProjWAR of the bottom six if he was able to push Sutter out and Beagle to the fourth line.
We would also likely see Green taking Schaller out to plug in Pearson, who’s WAR numbers last year hurt him in this lineup creation, which is why he was left off the top 12.With any luck, his WAR/60 will be closer to what he put up during his time in Vancouver than to his time in Pittsburgh or LA.
The right side after Boeser is quite intriguing as well. While the Lineup Creator favours Levio, we will probably see Green experiment with the three others starting with Ferland getting top six minutes.
The defensive group that results in the best ProjFSW with everyone playing their strong side offers a few surprises, to say the least.
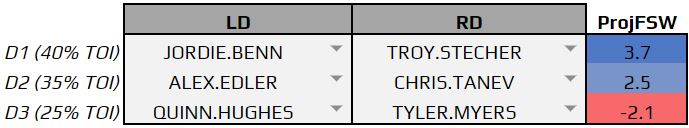
This model doesn’t reflect well on Hughes, who in his very small sample size of four games, put up -0.08WAR/60. This ProjFSW for Hughes is also based on NHLe prospect data that Sean pulled from Fenwicka. We can probablu assume that number will go up this year as he becomes more comfortable in the league. The same goes for Myers who had a tough year in Winnipeg analytically speaking and will look to gain comfort as well. Whether that comfort results in better WAR/60 rates is something fans will be eager to see.
These pairings may be far from expectations with Myers and Hughes likely to get looks in the top four from Green, while Benn likely won’t see first pair minutes; however, Benn was an analytical darling last year leading to the best WAR/60 out of the three LDs and the same goes for Stecher on the right side. Plugging names into slots that Green would more likely play them in would certainly lower the ProjFSW from the group.
If Edler is able to replicate his performance while he was healthy last year, he will be a very solid member of the top four. There’s still cause for concern with regards to Chris Tanev, who’s a major question mark at this point and doesn’t carry the same level of cachet as Myers or Hughes.. Health is also always a concern, but Fantenberg is a very capable seventh defenceman.
Instead of sticking with the default TOI settings that Sean has made, we have adjusted the TOI for Markstrom and Demko to reflect what may be their more accurate workloads. In the last two years, Markstrom has played 60 games and it seems like an amount the team is fine with, so we’ve gone with that for this exercise, which leaves Demko with the remaining 22. Needless to say, their TOI split is what effects the value created from their position the most.

Markstrom was 8th among goalies in total WAR last season, but he was also given plenty of opportunities to improve his numbers by playing the 5th most minutes among goalies. It will still be crucial for Markstrom to play big minutes this year as the Canucks hope to get the most WAR out of the position, especially when you consider that the alternative is Demko, who will still have kinks in his game to iron out.
The last interesting quirk that’s part of the WAR Lineup Creator tool is its ability to calculate the team’s approximate point total. Keep in mind that this calculation is based on this exact lineup playing all 82 games with the TOI breakdowns that Sean has implemented. While considered impossible, we see that this specific Canucks lineup is calculated to be a playoff team.

The calculation of the approximate points is the cherry on top of this neat tool and a feature that users will keep an eye on as they build their own lineups. However, the WAR Lineup Creator tool isn’t best used to predict the final total of points your team will end up with, because this lineup won’t play all 82 games with those exact time breakdowns throughout the season.
Instead, this tool is best used to see how the team’s production would change depending on the varying lineups we may see next season.

