Elias Pettersson’s Elite Penalty Differential Adds Yet Another Dimension to His Value

By Jeremy Davis
4 years agoThere are players in the NHL that excel at drawing penalties, and there are players in the NHL that excel at defending without taking penalties. There aren’t many players that excel at both. Those players are wizards, unicorns if you will. One such player is Vancouver’s own Elias Pettersson.
This season, Pettersson has drawn a whopping 21 minor penalties in his 37 games played (all situations considered), compared to just 4 minor penalties taken, resulting in a penalty differential of +17. The 21 drawn penalties are tied for the league lead (with Buffalo’s Jack Eichel), while the +17 differential leads the NHL this year by a substantial margin. Pettersson has a four penalty lead on the next closest players in terms of differential: a four-way tie between Eichel, Tampa Bay’s Anthony Cirelli, Colorado’s Nathan MacKinnon and Winnipeg’s Nic Ehlers, all at +13.
| Player | Team | Position | GP | TOI | Taken | Drawn | Differential |
| Elias Pettersson | VAN | C | 37 | 705.0 | 4 | 21 | +17 |
| Anthony Cirelli | T.B | C | 33 | 616.4 | 7 | 20 | +13 |
| Jack Eichel | BUF | C | 36 | 784.4 | 8 | 21 | +13 |
| Nathan MacKinnon | COL | C | 36 | 751.1 | 3 | 16 | +13 |
| Nikolaj Ehlers | WPG | L | 36 | 611.3 | 5 | 18 | +13 |
| Andrew Copp | WPG | C | 34 | 587.6 | 3 | 15 | +12 |
| Dylan Larkin | DET | C | 38 | 803.8 | 7 | 19 | +12 |
| Ondrej Kase | ANA | R | 31 | 490.0 | 2 | 14 | +12 |
| Anze Kopitar | L.A | C | 38 | 793.5 | 5 | 15 | +10 |
| Brandon Tanev | PIT | L | 36 | 525.5 | 5 | 15 | +10 |
For reference, only penalties that lead to changes in manpower are considered here – offsetting minors need not apply, as they are both different from a philosophical standpoint and lack the resulting swing in power dynamics.
Pettersson does benefit from his first line ice time, though by rate he’s still top ten in the league among those with 100 minutes played (9th in penalties drawn per hour with 1.79 and 3rd in penalty differential per hour with +1.45).
As an added note, those following closely at home may remember that some the penalties that Pettersson has taken this year have been… questionable.
Intuitively we can understand why penalty differential matters, but it often goes unnoticed and unappreciated. Broken down with numbers, we see that it can be a linchpin in the whole system. Power play offence is clearly of immense value, but you only get on the power play if you draw a penalty. Conversely, being strong at 5-on-5 is vital, but that value erodes if you’re constantly taking penalties and putting the team at a disadvantage.
The idea that penalty differential represents some hidden value isn’t a new concept. Gabriel Desjardins, one of hockey analytics’ founding fathers, drew attention to Patrik Kaleta’s penalty drawing abilities back in 2010. The venerable Eric Tulsky (now playing a prominent role in the Carolina Hurricanes organization) explored the concept in further detail in 2013 at Broad Street Hockey. Based on split-half correlation, Tulsky concluded that drawing penalties was a repeatable talent.
Andrew C. Thomas, founder of WAR On Ice and formerly over the Minnesota Wild and Oakland Athletics, was not as confident on this front. Detailing his WAR model in his Road to WAR series, Thomas wrote the following about taking and drawing penalties:
The “replacement” rate for taking penalties for forwards and defensemen is higher than the league average. When it comes to penalties drawn, forwards draw penalties at a greater rate than defensemen, which is to be expected on scoring plays; replacement rate at each position is roughly the same as the league average otherwise. This suggests that if drawing penalties is a skill, it’s exceptionally rare, whereas general discipline to avoid taking penalties is clearly a behaviour seen in full-time players. (emphasis mine)
While drawing penalties as a repeatable talent is still in up the air, no one can deny its value. When the hockey analytics community attempts to construct Wins Above Replacement models, there are a handful of statistical areas that consistently form the building blocks of such a metric. Even strength offence and defence are of course right at the top of that list. Power play offence and shorthanded defence cannot be discounted. But penalty differential is right there as well in terms of importance to the game.
The change in manpower on the ice fundamentally changes the way a hockey game is played and results in massive differences in expected goals for and goals against for the two sides. Thomas broke this down as well:
We convert to goals with an approximation: A team on the powerplay scores at a clip of roughly 6.5 goals/60 and allows 0.78 shorthanded goals/60. We move each of those rates from a 5v5 rate of 2.5 goals per 60 minutes, and assume that 20 percent of powerplays end in goals, for an average of 1.8 minutes on the PP, and reach an average figure of 0.17 net goals per penalty taken or drawn. For now we use the relation that 6 goals equals one win.
While WAR On Ice is no longer online, many others have taken up call with their own Wins Above Replacement models, including Dawson Sprigings (DTMAboutHeart), Emmanuel Perry (Corsica) and Evolving Hockey. Each denotes the importance of penalties drawn and taken, though we’ll focus on Evolving Hockey’s model here. EvolvingWild explored penalty differential here, and how it fits into their WAR model here.
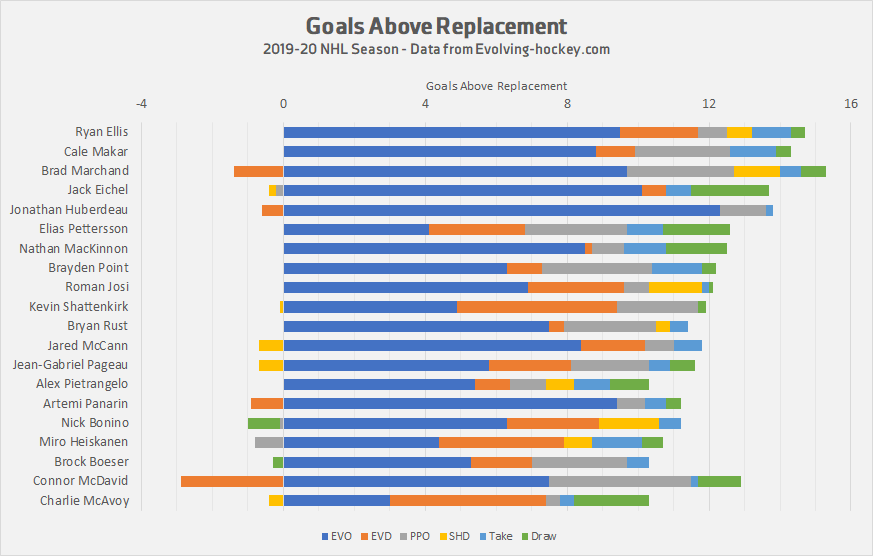
So how does this all relate to our player at hand? According to Evolving Hockey‘s Goals Above Replacement model, Pettersson’s drawn penalties have amounted to 1.9 goals compared to a replacement level player. On top of that, the low frequency of of penalties that he has taken relative to his ice time has generated an additional 1.0 goals above replacement. The combined 2.9 GAR for penalties drawn and taken leads the NHL, just above Nathan MacKinnon’s 2.7.
That penalty differential aids Pettersson in his overall GAR of 12.6, which ranks 6th in the NHL, just behind Jack Eichel and Jonathan Huberdeau.
Pettersson’s power play offence is also of course a major strength of his, so his ability to get them on the power play by himself has been exponentially beneficial. He’s been a key factor in why the Canucks are leading the NHL in power play opportunities this season (with 140) and in turn lead the league in power play goals (with 36) while converting at the fourth best rate (25.7%). You can also seen in the heat map below (from HockeyViz) the effect that Pettersson has while on the power play: with an extra shot per hour versus league average coming from his designated shooting area on the ice (lovingly referred to as the PetterZone).
While the opinions on drawing penalties as a talent are mixed, Pettersson is currently showing consistency in the regard through a season and a half. Last year, during his rookie season, Pettersson drew 33 minor penalties and one major penalty, good for ninth in the NHL. He took only six minor penalties, resulting in a differential of +28, which ranked fourth in the NHL. Given the way Pettersson plays the game, I think we can be fairly confident that this trend will continue for the foreseeable future.
As Canucks fans, we are all fully cognizant of the offensive firepower that Elias Pettersson brings to the table. Even his 5-on-5 defence, which is likely underrated outside of this market, is well appreciated within the confines of Vancouver. But his ability to position his team for success through good discipline and forcing opponents to break the rules in order to slow him down has added tremendous value on its own.
It’s not as if we could appreciate the magic that is Elias Pettersson any more than we already do, but it’s one more thing that Canucks fans have to brag about when butting heads with opposing fans.
Recent articles from Jeremy Davis