Deep Dive: How did Brandon Sutter fare as the team’s shutdown centre?

By Harman Dayal
5 years agoAs ironic as it sounds, Brandon Sutter’s biggest supporters are probably the ones doing him the most harm as it pertains to his public reputation.
Whether it be the lucrative extension he was given, the “foundational” label he was branded with, or the peculiar on-ice situations he’s been deployed in, it always seems as if the 28-year-old’s been given a responsibility or role he’s ill-suited of fulfilling.
The 2017/18 season presented perhaps the toughest challenge of all as first-year coach Travis Green entrusted Sutter with arguably the toughest deployment of any centre in the league.
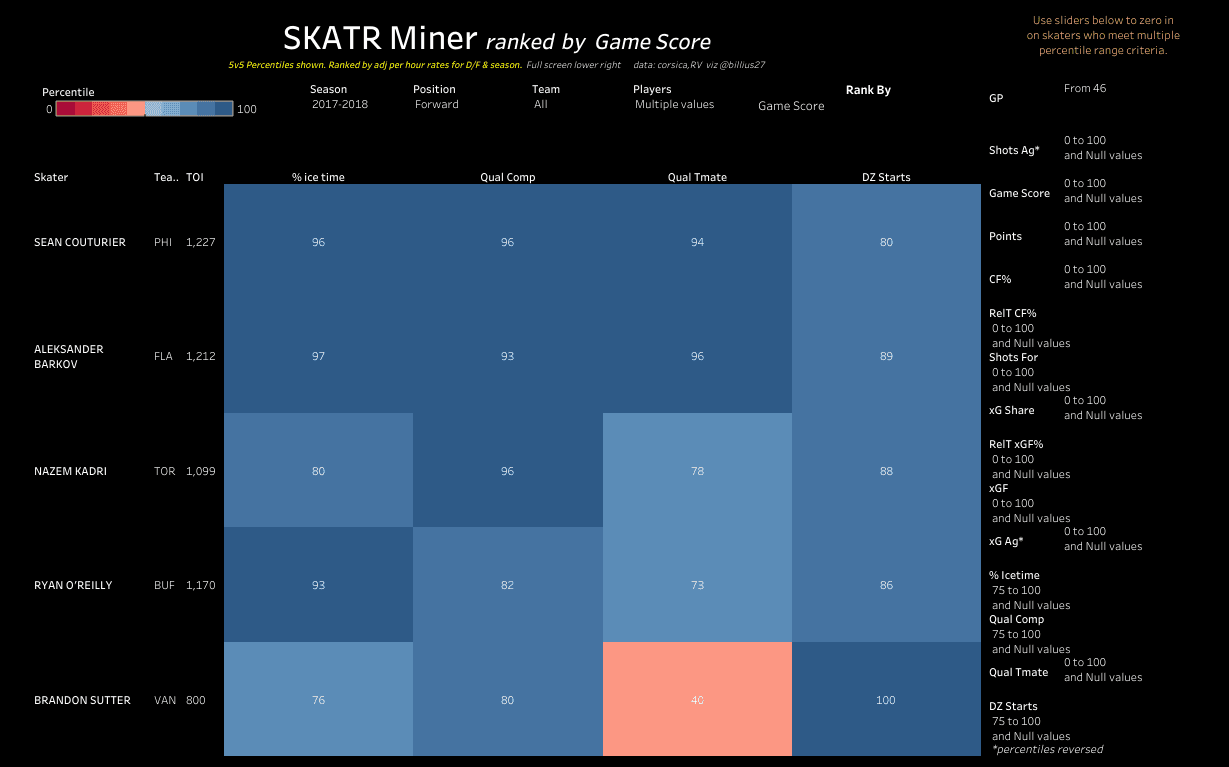
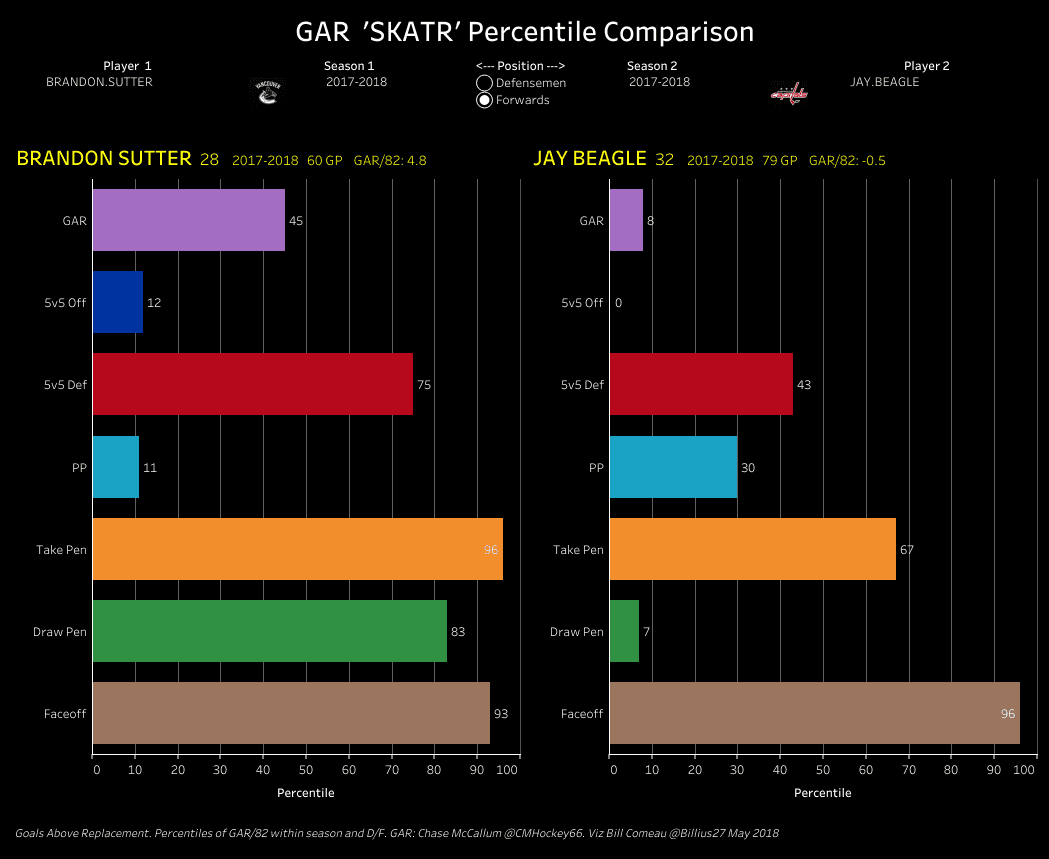
Viz courtesy Bill Comeau
Sutter was one of five NHL centres to finish among the top 25th percentile of forwards for time on ice, quality of competition and defensive zone starts. He did all this while playing with decisively inferior teammates relative to the other centres in the cohort.
As you might expect, his on-ice performance paled woefully in comparison to the elite, two-way players of the group.
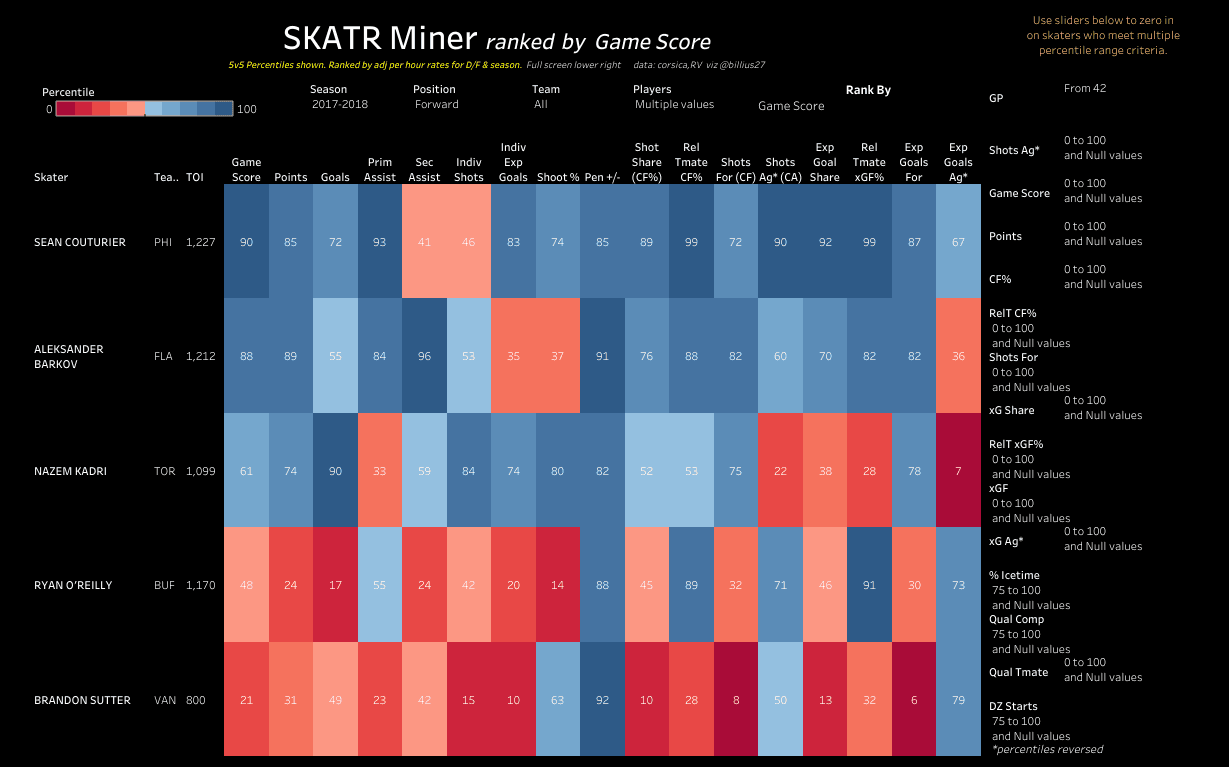
Viz courtesy Bill Comeau
Sutter’s results across the board insinuate that he was in way over his head in this extreme checking role. Unfortunately, Travis Green lacked options to balance the defensive load — Henrik Sedin needed sheltering, Bo Horvat was doing the heavy lifting offensively and the fourth-line hosted a rotating cast of mediocre pivots.
The problem with analyzing Sutter’s play is that it’s difficult to accurately adjust for quality of competition based on the publicly available information. There’s just not enough data to quantify the impact quality of competition has for on-ice results.
The closest thing currently available is CF.QOC which provides the weighted shot share of a player’s opponents. Unsurprisingly, Sutter finishes near the top of this list, though the discrepancy between him and the lowest Canuck forward(Jussi Jokinen) stands at a few hairs under one percent.
Theoretically, this means that quality of competition should create roughly a 1% discrepancy on a player’s shot attempt differential in extreme situations. This may sound alarmingly low, but it tends to align with the work of analytics pioneer Eric Tulsky.
Tulsky’s study theorized that quality of competition has a massive effect on a player’s on-ice results for a given shift, but that a player’s deployment is never extreme enough over the course of a season to create a substantial difference.
In other words, he’s saying that quality of competition isn’t black and white — a shutdown centre like Sutter will face the opposition’s top players for a higher proportion of his ice-time, but it’s not as if he’s exclusively playing against top-level talent. By that token, it’s inaccurate to qualitatively state that player x always plays against the other team’s best players or that player y always faces the weakest competition when those factors tend to normalize over the course of a full season.
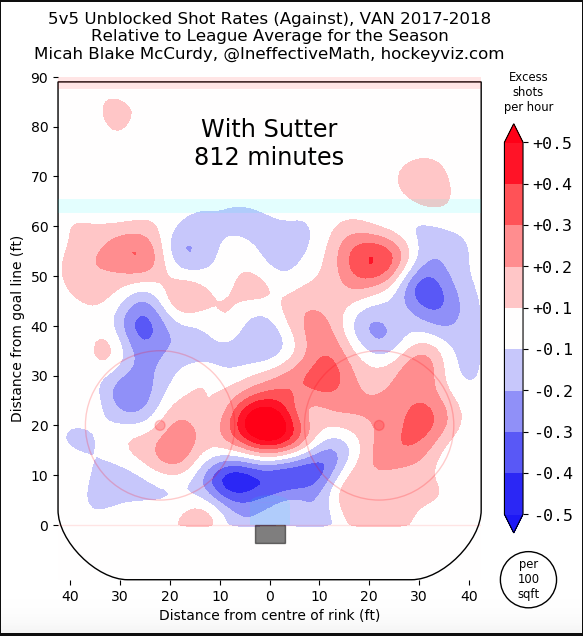
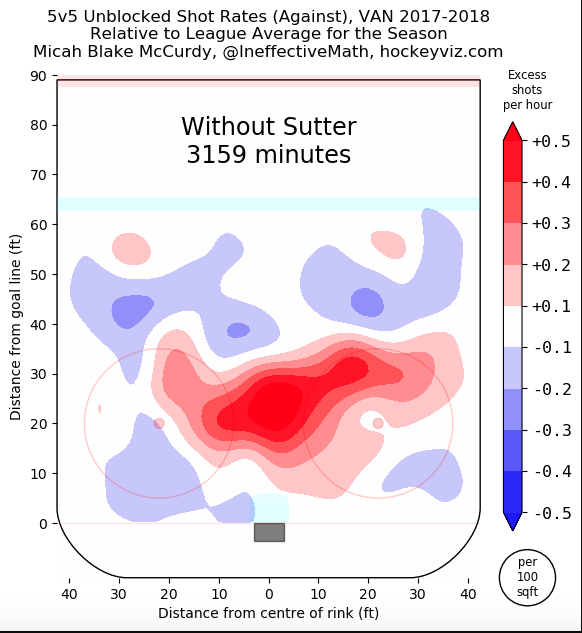
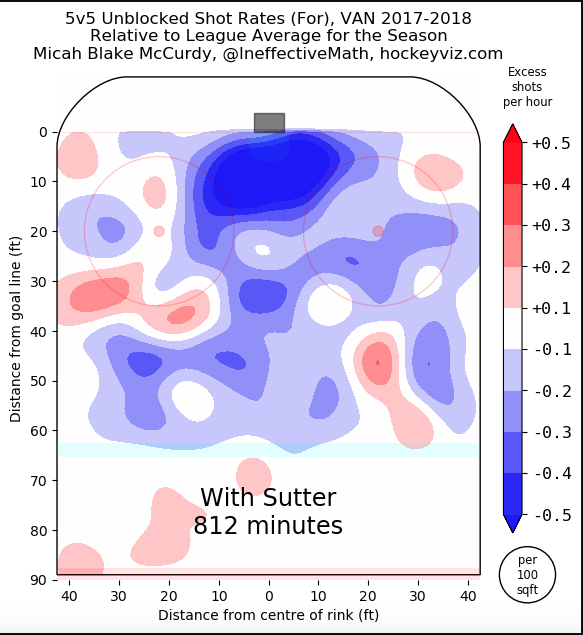
Fortunately, Micah McCurdy’s deployment visual can help us quantify the difference.
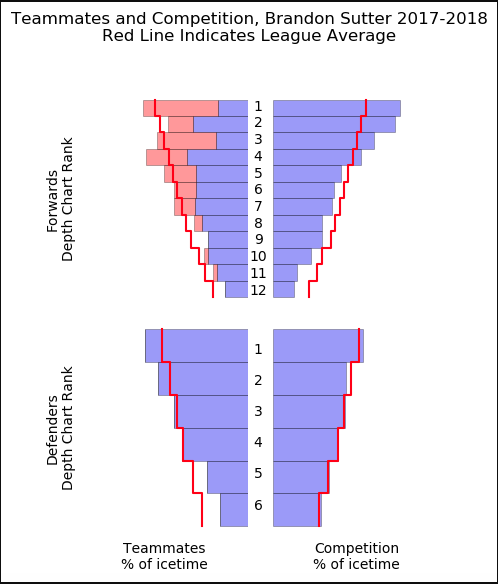
Chart courtesy Micah McCurdy, hockeyviz.com
The right side of the chart is pertinent for quality of competition. Here, the red line serves to represent the competition spread that the average forward faces.
As expected, Sutter spent a notably higher proportion of his ice-time against the other teams’ top line. But also look at the regularity with which he played against the opposition’s bottom-six(forward ranks 7-12). We can’t precisely pinpoint the proportions, but it’s apparent that he’s against those players for at least half the time relative to the average forward. Not as lopsided as you might expect.
Meanwhile, for defencemen, Sutter’s deployment more or less aligned with the spread of a typical forward.
In Sutter’s case, teammate quality may adversely affect his on-ice performance more than the typical shutdown forward. I think this because there’s a high possibility that studies don’t pick up a large quantifiable difference when examining quality of competition due to the fundamental way players are deployed.
Elite players usually draw other elite players, while sheltered players are typically matched against the opposition’s equivalent. This evens the playing field to an extent with the studies conducted on this matter. Think of this way: playing against top competition would likely hurt Sam Gagner more than it would Bo Horvat.
But since Sam Gagner will never actually play against the other team’s best players on a consistent basis, a study can’t quantify the difference like it can for a player like Horvat. This is relevant for Sutter because he had mediocre wingers by his side unlike his comparables Couturier, Barkov, Kadri, and O’Rielly.
As such, quality of competition was likely a greater factor for Sutter than it is in most cases. That’s all we can really say though; analysis beyond this scope would be speculative at best.
With that context out of the way, let’s take a deeper look at his contributions on both ends of the rink.
Defence
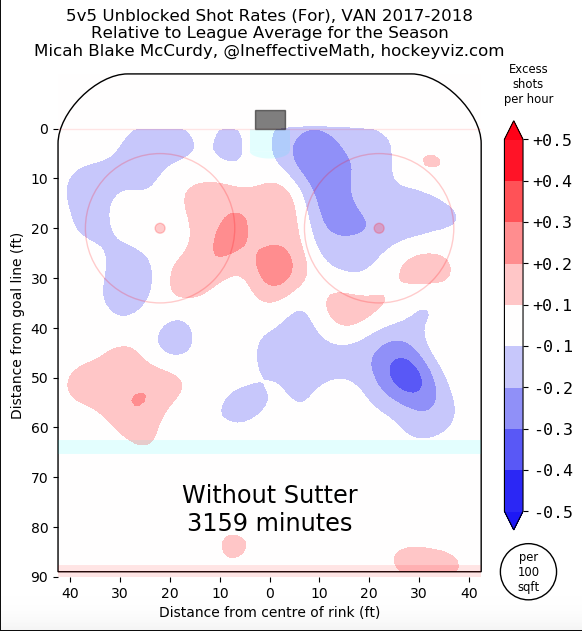
There’s a convincing argument to be made that Sutter shutdown the opposition to the best of his abilities.

Shot suppression may have been mediocre, but the Canucks conceded high danger shot attempts, expected goals, and actual goals against at impressive rates with Sutter on the ice.
The former first-round pick benefitted from a .948 on-ice five-on-five save percentage that was tops among Canucks’ forwards, but all the evidence suggests that he did well irrespective of his good fortunes.
Offence
To say the Canucks struggled to generate offence with Sutter on the ice would be an understatement.

Number in bracket represents ranking among NHL forwards(minimum 500 mins TOI to qualify)
Sutter finishes near the bottom of the league in nearly every on-ice offensive metric. For reference, here are the forwards that had worse expected goals for rates.
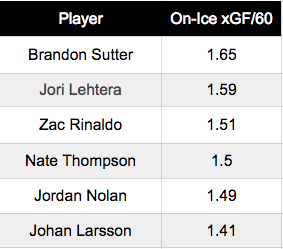
No offence to the other names on this list, but Sutter’s among some ugly company in this regard.
You’d be fair to point out that his actual on-ice goals for rate wasn’t as paltry, but research has shown that shot attempts and expected goal models are better predictors of future scoring than raw goals anyway.
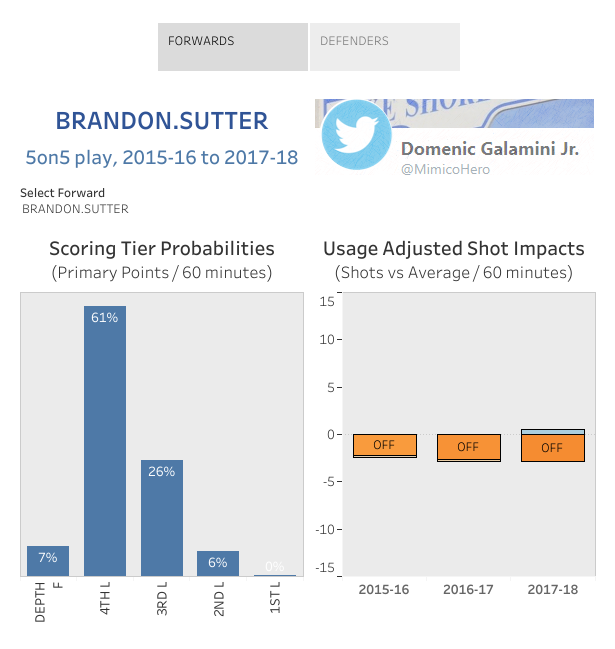
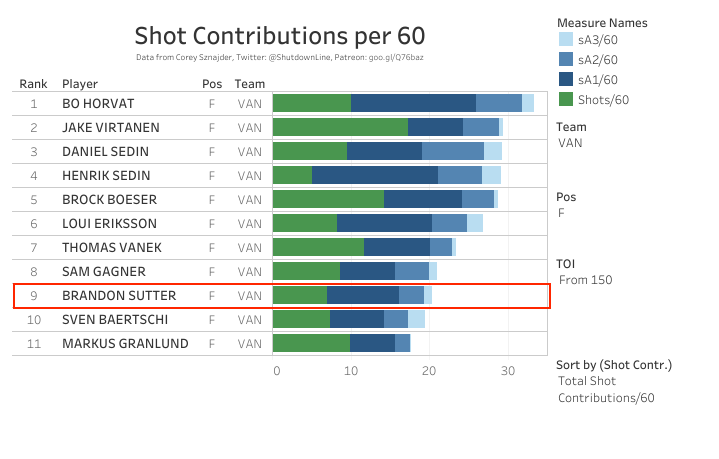
Individually, Sutter’s 26 points in 61 games sound respectable, but it turns out to a pretty poor scoring rate when considering that he was within a minute of Bo Horvat and Brock Boeser for average even-strength ice-time.
In fact, if you consider his usage over his entire tenure in Vancouver, you’ll realize that he’s been producing points at a 4th line rate for the past three seasons.
Perhaps most concerning is the alarming year over year decline in Sutter’s individual offensive play creation.

Data and visualization courtesy Ryan Stimson
It’s hard to attribute Sutter’s disappinting offensive results as the product of his subpar linemates when he himself struggled mightily to make plays.
Data courtesy Corey Sznajder, visualization by CJ Torturo
Of course, it’s entirely possible that these rates slipped because his line struggled to get into the offensive zone in the first place, but that would require admitting that they were consistently chasing the puck on the wrong side of the rink.
Regardless, it’s a big issue that the team was unable to score goals for nearly a third of the game.
Is the offensive tradeoff worth it?
This past season’s results portray Sutter as a one-way, defensive player. That certainly has value, but much like a scoring forward with defensive issues, the positives have to outweigh the deficiencies for a worthwhile net result.
For this season, the raw scoresheet results tilted in Sutter’s favour, as he finished as one of five Canucks’ forwards with a goal differential above 50%. Of course, that fails to take into account his aforementioned .948 on-ice save percentage; one that is both ranked eighth highest among league forwards who played at least 500 minutes and quite frankly unsustainable.
Percentage fluctuations are a big reason why on-ice metrics are relied upon as predictors for future goals rather than raw scoring. By this method of evaluation, Sutter fared far worse.
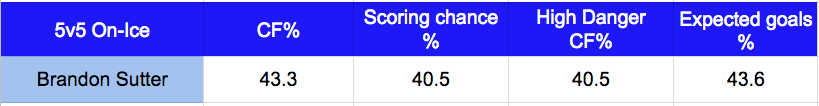
Sutter once again found himself near the bottom of the league through the lens of underlying numbers; this time falling short with his shot attempt, scoring chance, high danger attempt and expected goal shares.
On the brighter side of things, he was still able to prove his mettle through a disciplined playstyle and continued faceoff success.
This circles us back to my original assertion about Sutter being asked to do too much. It’s tough to pinpoint how much deployment is skewing his play, but it’s clear nonetheless that he needs some help.
As much as I hate Jay Beagle’s contract, Jim Benning was on the mark with his idea of finding a fourth-line centre to provide defensive support. Unfortunately, Henrik Sedin’s departure means that Beagle will more or less soak up those minutes, which while helping Sutter defensively, will put the team at a massive disadvantage offensively.
Without a clearcut second-line centre, Sutter will likely be asked to continue playing 17+ minutes a night. It’s an unfortunate reality because he’d likely be far more effective with reduced minutes and easier deployment as a traditional third-line pivot.
Author’s note: Since this article went well beyond the scope of a typical year in review piece, I decided it deserved its own standing. Given the article’s analysis of Sutter’s play this year, there will be no additional year in review article for him.
Recent articles from Harman Dayal