Canucks Total Player Charts

11 years ago
Among nerdlinger types who value advanced stats in hockey, ice time is seen as perhaps the single most invaluable stat. Tom Awad, for example, has argued that ice-time is the best proxy we’ve got at the moment for determining overall player value.
If you’re like me, and tend to think that NHL headcoaches, who are paid millions of dollars to maximize the effectiveness of their hockey teams, have a better overall grasp of which players are effective in particular roles than your average fan or hockey scribe; then understanding the way a player is deployed can tell us an awful lot about that individual’s skillset and value.
In an effort to visualize this concept in an accessible way, Ben Wendorf came up with the "total player chart" in a must read NHLnumbers post in mid-December. On Tuesday he put together detailed charts for every Canucks player over the past five seasons (the image at the top of this post is the TPC for the Canucks last season), and I figured I’d share the images and caption them with some analysis for your reading pleasure. Read on past the jump for more.
Before we get to some Canucks centered analysis, I’ll quote Ben on the methodology behind the TPC radar plots:
I suggested that we could better refine and increase predictability of even-strength ice time by expressing it as a percentage of the team’s even-strength time in games the player played (a wordy way of describing 5v5%). Though it will probably be a post in-and-of-itself, 5v4% and 4v5% are both testing to be similarly positive refinements on those TOI metrics.Rather than handle that today, I wanted to unveil a little idea that had been bouncing around my head for a while. I’ll be damned if I can recall the post from Beyond the Box Score, the excellent baseball statistics web site, but they had a season preview a while back where they used radar plots of a number of metrics like OBP, Fangraphs’ Baserunner rating, UZR/150 (something to that effect), and for each player on a given team their talent in those metrics filled a certain portion of the radar plot. The more you filled the radar plot, the better you were.There’s certainly room for doing this when the statistical hockey gods agree on a metric already (spoiler alert: they never will) – till that time I’m content to build a radar plot of three metrics, 5v5%, 5v4%, and 4v5%. In part, this is to represent player value, as well as where that value gets allocated (just even-strength, or powerplay and penalty kill as well).
Two quick notes before we get started. In the images we’ll look at below, the radar plots are adjusted to team-high TOI% (so, in the image that leads off this post Ryan Kesler fills the entire plot despite not being on the ice for every single moment when Vancouver played 5v5 hockey).
Secondly, the line combinations are determined by even-strength deployment – so occasionally a player with less overall ice-time (like Tanner Glass and Shane O’Brien in the first image below) will appear on a line or pairing above their pay grade.
Let’s see what we can see, shall we?
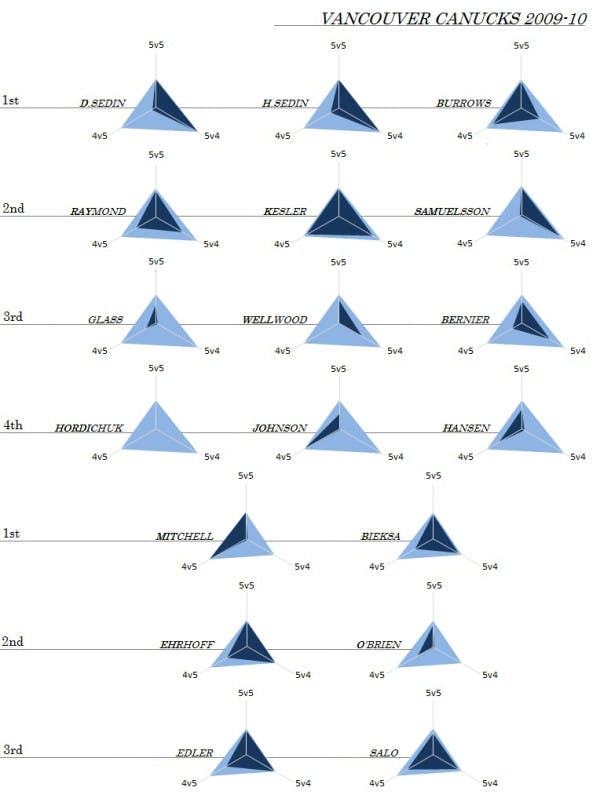
You’ll recall that the 2009-10 Canucks were extremely injury prone along the blueline. Kevin Bieksa missed 27 games, Willie Mitchell missed half of the season, Sami Salo missed 14 games, and Shane O’Brien missed 17 games as well as a handful of team practices. Because these charts calculate ice-time as a percentage it looks like Vancouver’s blue-line consisted of six top-four defensemen, but in reality, it’s just that Vancouver’s blue-liners often had to pick up the slack for their injured teammates.
One trend I’d point out along the blueline, is that this (2009-10) was the last season in which the Canucks frequently deployed a top-four blueliner as a defensive specialist (Willie Mitchell, and when he was injured: Shane O’Brine). In June and July of 2010, the Canucks acquired competent two-way defenseman Dan Hamhuis and Keith Ballard in an effort to speed up the club’s transition game.
While Keith Ballard has turned out to be more of a no-way defenseman in Vancouver, I’ve long contended that the club’s choice to allow Willie Mitchell and Shane O’Brien to walk in favour of Ballard and Hamhuis was defensible (even if it hasn’t necessarily worked out for the club).
Among forwards, I find it interesting to look at the 5v4 ice-time of the second line forwards in this graph and contrast it with what we see in 2010-11 and 2011-12. Ryan Kesler, for example, doesn’t quite fill the radar plot in the above image; but his power-play ice-time increased dramatically in 2010-11 as a result of the Newell Brown hire, and the "loaded first unit" approach he’s brought to Vancouver’s power-play. Kesler’s expanded power-play role comes at the expense of Mikael Samuelsson, Mason Raymond and Alex Burrows among others.
Another thing I think is worth pointing out is Ryan Johnson’s TPC plot. Because of Johnson’s ability to win face-offs and his experience playing in his own zone (Ryan Johnson is one of the worst possession players in the Behind the Net era, so spent a lot of his time in his own zone) he still brought some value to Vancouver in the 2009-10 regular season as a penalty-killing specialist. In the postseason, of course, the Los Angeles Kings scored on something like 6 straight power-play opportunities (if memory serves) in the six game first round series between the two teams. Between that ghastly outing and the fact that Ryan Johnson had next to no value at even-strength anyway, he was out of a job in Vancouver.
Let’s look at how that compares with Manny Malhotra’s TPC during the 2010-11 season…
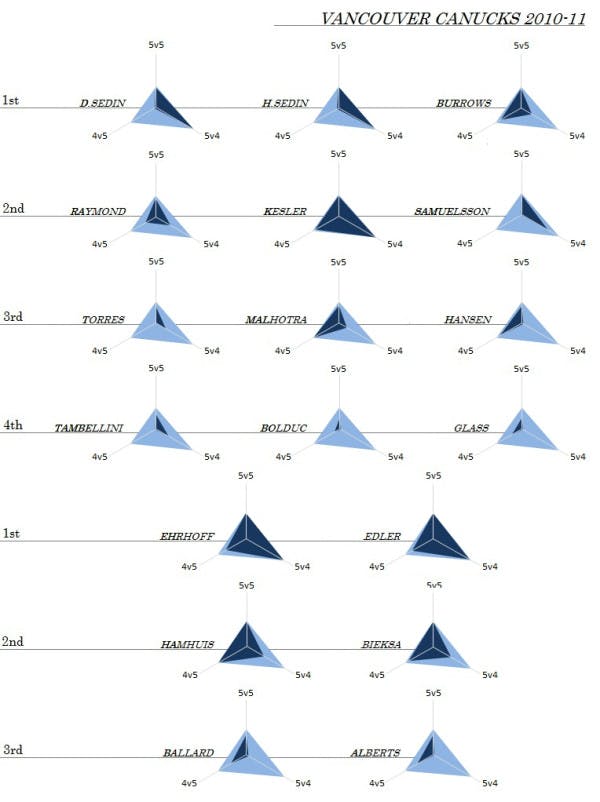
As you can see, Manny Malhotra was a much more valuable player to the Canucks in 2010-11 than Ryan Johnson was in 2009-10. Ryan Johnson’s inability to effectively soak up even-strength ice-time rendered him incapable of playing the sort of "enabler" role that Malhotra did in 2010-11; and it’s no coincidence that the Canucks rocketed to the top of table when they subbed in Malhotra for Kyle Wellwood and Ryan Johnson…
In 2010-11 we can also see that Ryan Kesler begins to completely fill out his TPC plot, as he joined the Sedins on the first power-play unit. You’ll also notice that Mason Raymond, Mikael Samuelsson and Alex Burrows all see their 5v4 ice-time drop significantly as a result. We also see Jannik Hansen emerge as a bonafide top-9 forward and penalty-killing specialist, while the presence of Manny Malhotra freed Henrik Sedin up from any short-handed responsibilities.
Along the blue-line, we might notice the very precise, orderly stratification of responsibilities between the three pairings (this matches Alain Vigneault’s the zone-start deployment patterns that season as well) that the Canucks utilized in 2010-11. The Canucks had an offensive specialist pairing in Ehrhoff and Edler, who at even-strength started the majority of their shifts in the offensive zone and were the team’s primary defense pairing on the power-play. They had a shutdown pairing in Bieksa and Hamhuis, who ate up the bulk of the club’s penalty-killing ice-time while also handling the tough minutes at even-strength. The third pairing was counted on to play low-event hockey against the third and fourth lines of opposing clubs, and occassionally filled in on the penalty-kill.
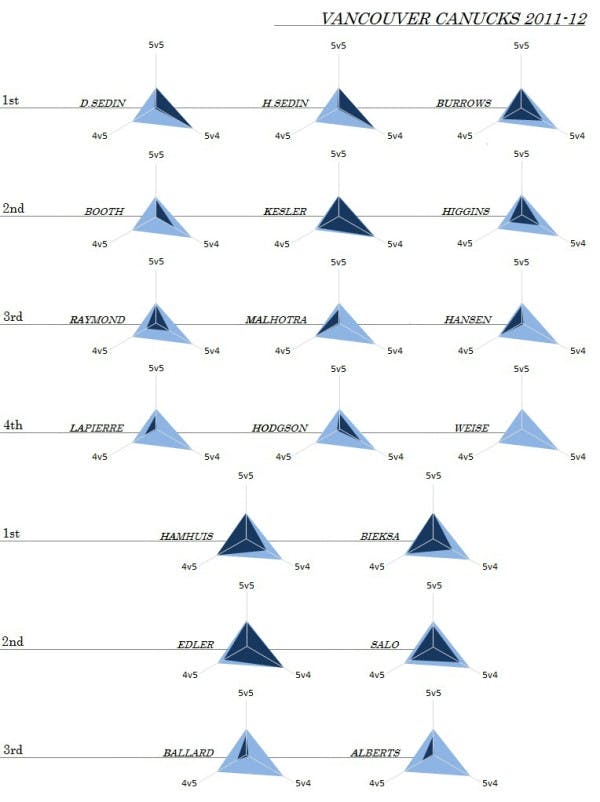
We already published the following image at the top of the post, but let’s revisit and caption Vancouver’s 2011-12 TPC plots for the sake of continuity:
There’s not much difference in the Canucks’ forward deployment between 2010-11 and 2011-12, although there is some new personnel in Chris Higgins, David Booth and Maxim Lapierre. Alex Burrows and Jannik Hansen each got a slice more power-play time than they did in 2010-11, but otherwise the major change is in Manny Malhotra’s TPC chart. You’ll notice that his 2011-12 TPC much more closely resembles Ryan Johnson’s in 2009-10 than it does Malhotra’s 2010-11 plot.
Coming off of his freak eye injury, Malhotra was unable to work out in the offseason before 2011-12, and partly because of this (or because of his diminished range of vision) he became more of a penalty-kill and defensive-zone start specialist than a two-way force. It’ll be interesting to see how much of his past effectiveness Malhotra can find going forward, and while I’m skeptical that he’ll ever be 100% again, I’m certainly rooting for him (more as a fellow human being than as a Canucks fan).
Along the blue-line, you’ll notice that Bieksa, Salo and Hamhuis all saw their power-play ice-time increase in 2011-12 as the Canucks sought to replace Christian Ehrhoff by committee. That effort met with some mixed results, and I’m not sure the Canucks are poised to return to the more orderly stratification of responsibilities that the roster evinced in 2010-11 next season. Needless to say, Jason Garrison doesn’t profile as a natural Christian Ehrhoff replacement…
So those are TPC plots. My sincerest gratitude to Ben for putting these together and allowing us to break them down and geek the fuck out. Personally, I find these visual representations of player value and deployment extremely insightful especially because of how closely they matchup with the way the Canucks massage zone-starts at even-strength…
Oh and here’s one final, bonus nugget before I go jump into the pool. A .gif of Vancouver Canucks TPC’s from the past five seasons:
Recent articles from Thomas Drance