By the Numbers: Canucks after 60 Games
7 years ago

Photo Credit: Billy Hurst – USA TODAY Sports
When one compares how the Vancouver Canucks season’s played out to date to what most expected, you can count theirs among the more compelling seasons in recent memory. Many fans expected the Canucks to fight to the end for a playoff spot; others expected them to compete for draft lottery prominence.
No matter one’s hopes or perspective of the season, it’s always worthwhile to take stock of where the team is at and which end of the spectrum it aligns with closest. As we await the Canucks first game on other side of the bye week against the San Jose Sharks on Saturday, the league’s afforded us the opportunity to do just that.
The added advantage is that as the Canucks catch up on much-needed r-and-r, their stats aren’t in constant flux. That’s granted me the time necessary to tabulate and graph the necessary information to compare season against season and where league average rested. At times, I’ll compare the last two seasons solely so as to avoid confusion with the team that ultimately made the playoffs in Canucks general manager Jim Benning and head coach Willie Desjardins’ first season. There will also be times when I compare all three.
Points Percentage
If you’re familiar with this graph, that’s with good reason. I’ve been posting it semi-regularly with updates as the Canucks season has carried on to show how they’ve fared compared to last season.

That nine-game losing streak sticks out like a sore thumb. The Canucks’ point percentage after 60 games is as follows.
| Game # | 2015-16 | 2016-17 |
| 60 | 0.5 | 0.483 |
If the Canucks were able to complete the comeback against the Flyers on Sunday night, they would’ve been in the exact some spot as they were after 60 games last season.
The Canucks struggled after Game 68 last season, and aside from the infamous California swing near the end, stumbled to its conclusion.
I wouldn’t expect them to replicate the same record to end the season, but there’s no doubting they are behind the eight ball. As I broke down yesterday, teams coming out of their bye week struggle to win hockey games. A loss to San Jose on Saturday would put them even further behind.
Special teams
We’ll start with the Canucks powerplay. It’s been a struggle to watch at times, as the Canucks just can’t seem to get setup and create high-end chances. When we compare to last season, except a few games between Game #5 and Game #10, they have trended below last season’s pace.

| Game # | 2015-16 PP% | 2016-17 PP% | |||||||
| 60 | 17.6% | 14.5% |
If you look at the amount of powerplay opportunities and goals (listed below), the Canucks are seeing very similar power-play opportunities, but have scored six fewer goals. That explains the drop-off in percentage.
| Game # | 2015-16 PP Opp. | 2016-17 PP Opp. | 2015-16 PPG | 2016-17 PPG | |||||
| 60 | 182 | 179 | 32 | 26 |
As for the penalty kill, for the most part, they’re trending above the 2015-16 line this season. It did dip below the line at the 47 game mark and currently sits there:
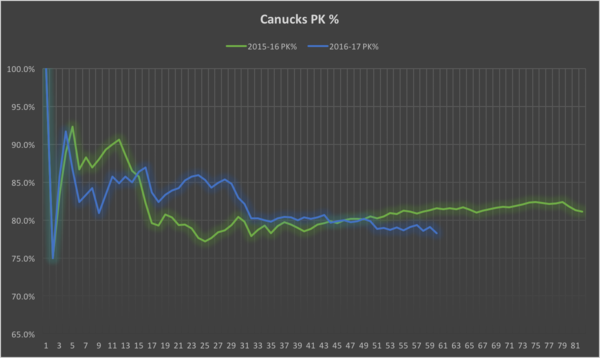
| Game # | 2015-16 PK% | 2016-17 PK% |
| 60 | 81.6% | 78.3% |
The difference in percentages for the Canucks in the year over year comparison for the PK is due to taking fewer penalties.
| Game # | 2015-16 PK Opp. | 2016-17 PK Opp. | 2015-16 PK GA | 2016-17 PK GA |
| 60 | 190 | 161 | 35 | 35 |
Simply put, the Canucks are heading to the box less often, but have given up the same amount of goals, thus the 3.3% change in percentages.
CF% and FF%
Corsi for percentage:
2015-16: 47.22%
2016-17: 48.59%
2015-16: 47.22%
2016-17: 48.59%

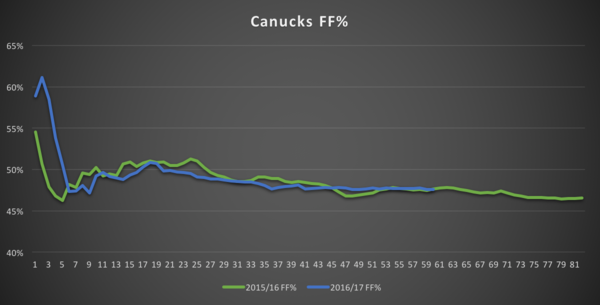
Fenwick for percentage:
2015-16: 47.62%
2016-17: 47.59%
2015-16: 47.62%
2016-17: 47.59%
Goals For and Against
At the moment, the Canucks have scored fewer goals than they did last year, and have given up more.
Goals scored:
2015-16: 143
2016-17: 138
2015-16: 143
2016-17: 138
Goals against:
2015-16: 168
2016-17: 170
2015-16: 168
2016-17: 170
Looking at the goals for and goals against for this season only.
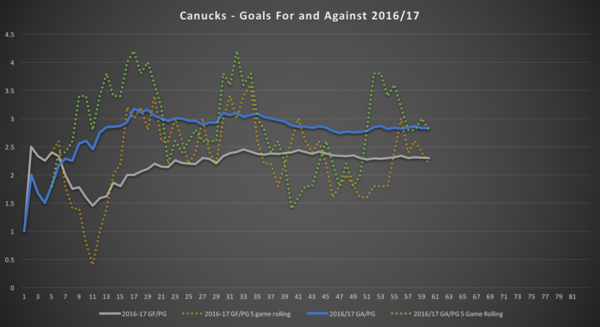
The goals for saw a dramatic crash during the nine-game losing streak, but saw a sustained above team average production for the awhile after. The goals against have been extremely volatile throughout the season. When we compare the Canuck GF/G year over year:
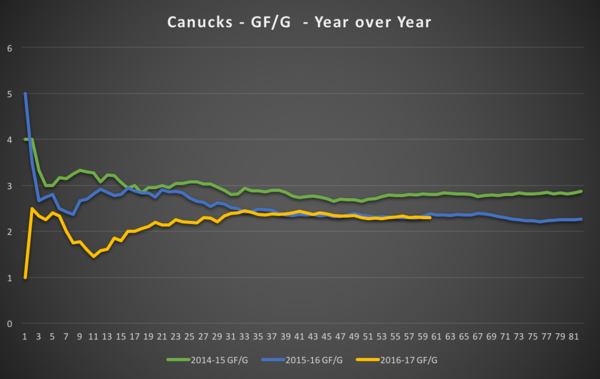
| Game # | 2014-15 GF/G | 2015-16 GF/G | 2016-17 GF/G |
| 60 | 2.8 | 2.38 | 2.3 |
I’ve added the 2014-15 season to allow for some more insight into the trend-lines.
What sticks out for the goals for, is that the Canucks are scoring a full 0.5 GF/PG less than their pace from the 2014-15 season.
At the end of the 14-15 season, the Canucks had 12 players who had 10 or more goals. Of that group, seven of them are gone. The only return currently on the roster for Chris Higgins, Nick Bonino, Yannick Weber, Zack Kassian, Linden Vey, Shawn Matthias and Radim Vrbata was Brandon Sutter (as part of a Bonino package).
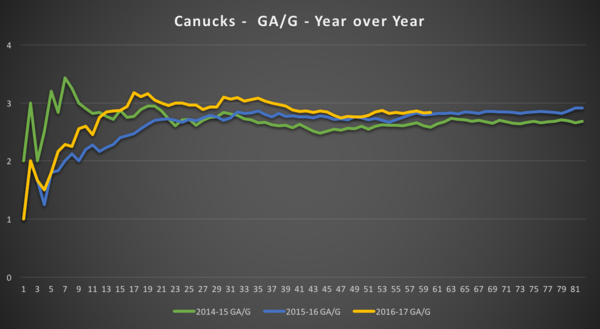
| Game # | 2014-15 GA/G | 2015-16 GA/G | 2016-17 GA/G |
| 60 | 2.58 | 2.80 | 2.83 |
The Canucks are giving up 0.35 more goals per game than they did in 2014/15. Obviously, that has to do with the organization rebuilding the core and getting younger. It will take time, but it is interesting to see that they are basically on the same pace as last season in this regard.
Injuries
Last season, Canucks management stated that they would’ve been able to complete for a playoff spot, had Sutter and Edler been healthy for the season. We will never know, but it’s interesting to look at the data, and see how they have trended compared to last year. At the 60th game mark, the Canucks man-games lost (MGL) are as follows
| 2015/16 | 2016/17 | |
| MGL – Forward | 70 | 160 |
| MGL – Defence | 91 | 104 |
| MGL – Goalie | 21 | 4 |
The Canucks have been best with more injuries on forward and defence this season. But it’s important to remember who and when players have been injured. Dorsett has only appeared in 14 games (thus 46 MGL), and Rodin has dressed in 3 games (so 57 MGL). If you take those two out, the Canucks have only sustained 57 MGL on forward.
On defence – Gudbranson has missed the last 30 games.
Other stats
A few more stats that likely don’t need to be graphed or visualized.
The below table includes a few stats to compare over the last three years – in this case, the 2014-15 and 2015-16 stats are based on year-end, while the 2016-17 is current:
| 2014/15 | 2015/16 | 2016/17 | |
| SH% | 9.6% | 8.0% | 8.1% |
| PDO | 100.6 | 99.3 | 99.3 |
Where are they in the league?
Lastly, how do the Canucks rank amongst the rest of the NHL for the season:

It’s clear that the Canucks are trending towards the same spot that they were last season. Injuries have played a part in the issues, but Rodin, Dorsett and Gudbranson don’t make the same impact to the lineup as the Canucks suffered last season with long term injuries to Edler, Hamhuis and Sutter.
What is concerning is the comparison between the 2014-15 season and the following two. Obviously, the Canucks got lucky when making the playoffs that year, in part due to a higher than league average shooting percentage (9.6% over league avg of 8.9%) which gave a 100.6 PDO. But a decrease of 0.5 GFPG and an increase of 0.35 FAPG is a huge contrast.
Also of concern is the age of the Canucks. With Virtanen in the minors, the Canucks’ average age has risen 28.8. That is way too high for a team rebuilding, retooling, or whatever you want to coin it as. Fortunately, the Canucks will drop in age next, but sending out some of their pending UFA’s will help in that aspect.
It’s clear that the Canucks are basically the same team as they were last season, but due to other teams performance, the playoffs were a tangible dream. That dream should be but a memory now that the Canucks wake up today being 8 points behind Calgary.
It’s time to sell.
All data is up to and including games on February 23rd
Underlying numbers from Corsica
Injury information fro NHL Injury Liz
All of other data from hockey-reference.com